When a major index records a new high, I go straight to the key breadth indicators to see if these highs were confirmed. Breadth indicators are sometimes called "internal" indicators because they measure what is happening inside a specific index or ETF. We can see what is happening on the outside by looking at the price chart of the underlying index, but we need breadth indicators to analyze the innards. The S&P 1500 hit a new high this week and today we will see if this high was confirmed with internal strength.
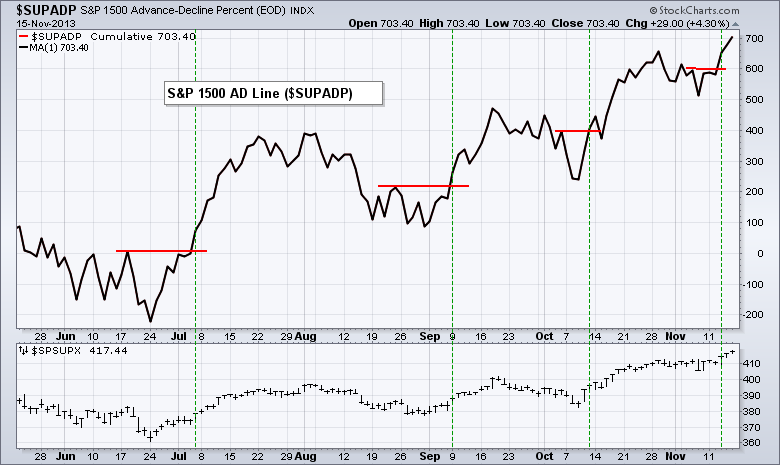
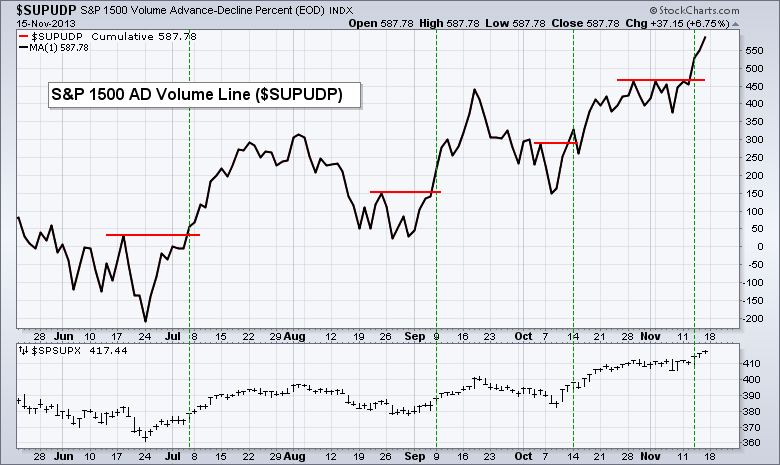
First, let's review the index and the breadth indicators. The S&P 1500 is a great index for breadth indicators because it combines the S&P 500, the S&P Midcap 400 and the S&P SmallCap 600. The combination of large-caps, small-caps and mid-caps makes this an ideal index for measuring broad market breadth. The AD Line is a cumulative measure of net advances (advances less declines). This indicator captures the performance of small and mid-cap stocks. An advance counts as +1 and a decline counts as -1, regardless of volume or market cap. With more small and mid caps than large-caps, this indicator clearly favors the little guys. The AD Volume Line is a cumulative measure of net advancing volume, which is the volume of advancing stocks less the volume of declining stocks. This indicator reflects the performance of large-caps because large-cap stocks typically trade much more volume than small and mid-caps.
Click this image for a live chart
The chart above shows the S&P 1500 AD Line ($SUPADP)** pulling back from late October to early November and then breaking out with a surge this week. The indicator exceeded the late October high and forged a 52-week high, just like the underlying index (S&P 1500). Potential trouble starts if/when the AD Line fails to confirm and forms a bearish divergence. The chart below shows the S&P 1500 AD Volume Line ($SUPUDP) also breaking out and hitting a new high. This indicator has been trending higher the entire year with a series of higher highs and higher lows. The early November low now marks first support. With the S&P 1500 and these two breadth indicators hitting new highs, the long-term uptrend is clearly intact and clearly strong.
Good weekend and good charting!
Arthur Hill CMT


