When I map out my trading strategies, I consider fundamentals, especially quarterly earnings reports, but I FOCUS on technical indicators. The study of price action helps to determine future price action, but note that it doesn't guarantee it. The basic premise of trading is to set up the odds as best you can in your favor and manage the risk you take in order to achieve your trading objectives, whatever they might be.
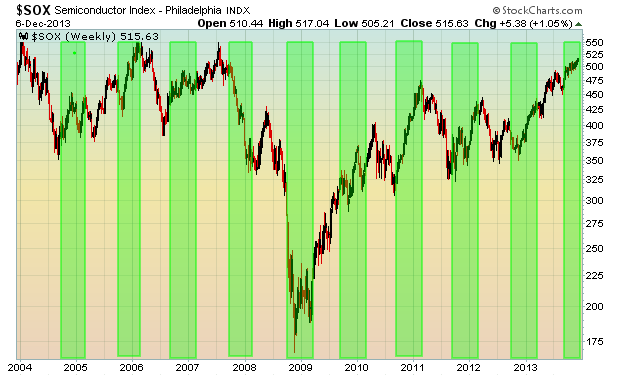
In a recent article, I discussed the market's tendency to move higher from the October 27th close to the January 19th close. Take a look at this visual on the semiconductors ($SOX):
The green highlighted areas shows the performance (roughly) of the SOX during that bullish Oct 27-Jan 19 period each year over the last decade. The end of 2007 into 2008 was clearly a bearish period, not only for semiconductors, but for the stock market in general. Most of these years, however, show significant gains during this bullish historical period.
It prompted me to do a quick study.
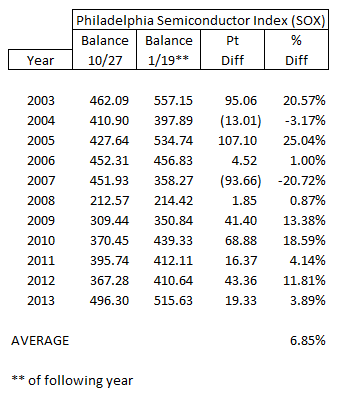
A little more than ten years ago on October 27, 2003, the SOX stood at 462.09. After the recent rally, we're now at 515.63. We're up a little more than 10% for the ENTIRE 10+ year period. But check out the performance of the SOX during the bullish period I've identified during each of the last 10 years, plus what it's done thus far in 2013 in the table below:
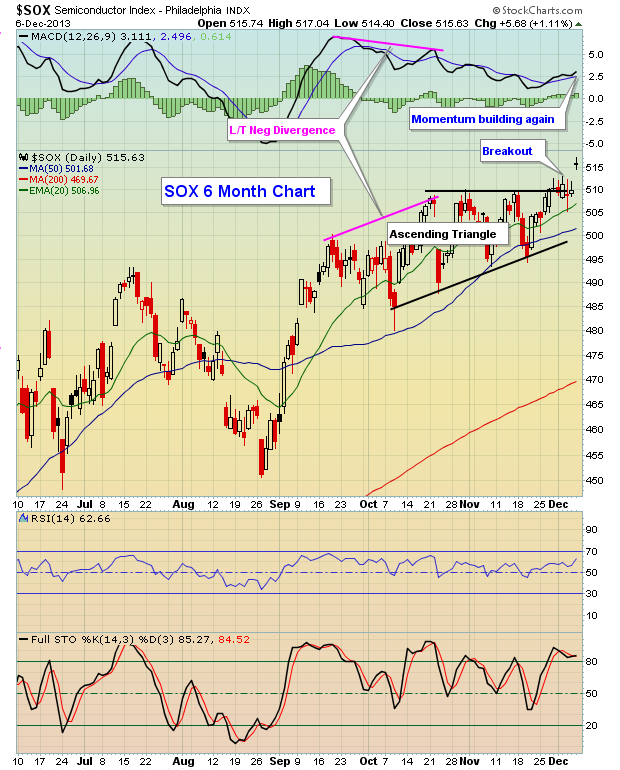
To me, those historical tendencies are undeniable. Why am I bringing this up? Because the SOX just made a significant technical breakout with 6 weeks left in this bullish timeframe. Check out the SOX breakout late last week:
I've written a white paper on the Four Historical Rules Every Trader Should Know. To claim your copy for FREE, simply CLICK HERE
Happy trading!
Tom Bowley
Chief Market Strategist/Chief Equity Strategist
Invested Central/EarningsBeats.com


