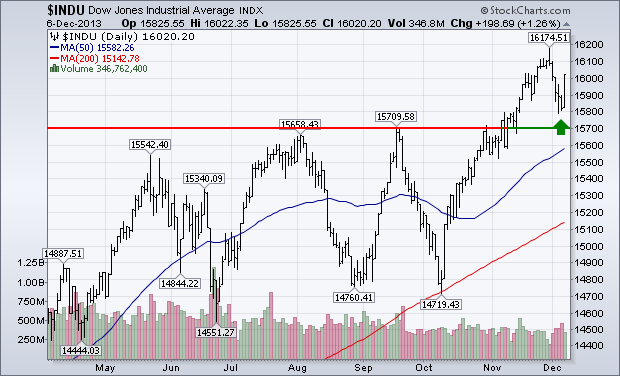
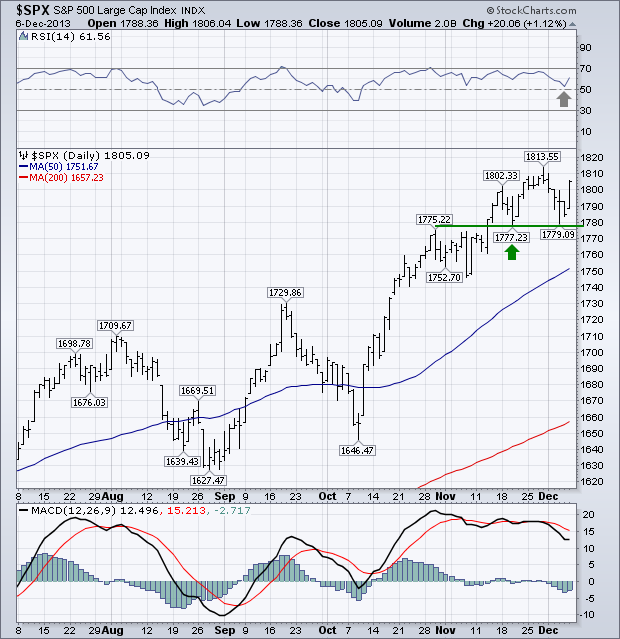
Friday's announcement that U.S. payrolls rose by 203,000 during November with the unemployment rate falling to 7% (the lowest level in five years) topped a week of encouraging economic news. Stocks rose strongly on that report, which suggests that good news is finally being recognized as good news. Recently, it seemed like every sign of economic strength raised concerns that it increased the odds for earlier Fed "tapering" of its monthly bond purchases which would push bond yields higher. Bond yields did jump initially on Friday before ending unchanged on the day. It should be remembered, however, that bond yield had already gained twelve basis points during the week. The fact that bond yields weakened yesterday afternoon no doubt encouraged stock bulls. There seems little doubt that bond yields will climb higher next year. The good news, however, is that they'll be climbing for the right reasons -- stronger economic growth with little or no inflation. Friday's rally appears to have ended the recent pullback. Chart 1 shows the Dow Industrials climbing 198 points (1.26%), and did so well above chart support drawn along its September peak. The only thing missing was higher volume. Chart 2 shows the S&P 500 climbing 20 points (1.12%). The SPX bounced off initial chart support at its mid-November intra-day low at 1777. Its 14-day RSI line (above chart) bounced off 50 which is good. Its daily MACD lines improved on the day, but remain negative. They will need to turn positive to confirm resumption of the uptrend. As I suggested earlier in the week, the market usually ends the month of December on a strong note (the Santa Claus rally). Odds of that happening this year now look a lot better.


