In the forest of information, sometimes the trends don't jump out easily.
Rolling through my dashboard charts, I noticed the energy group was on a real roll for the last month.
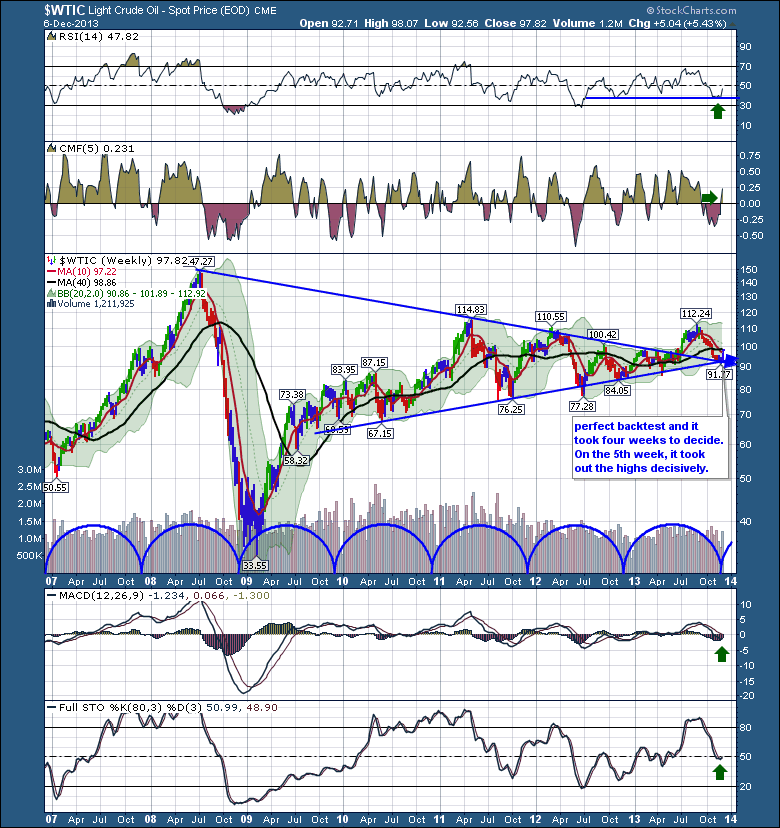
First of all, the big picture in crude oil is at technicians dream time and price. While dreamy may seem strong, look at the chart.
The 5 year pennant for crude oil broke to the upside in July. The decision point at the apex of a pennant is pretty important.
Should the centre line of the apex fail to hold, this would be considered a continuation pattern lower.
The cycle arcs at the bottom have a pretty good track record for lows this time of year and the acceleration out of the time frame.
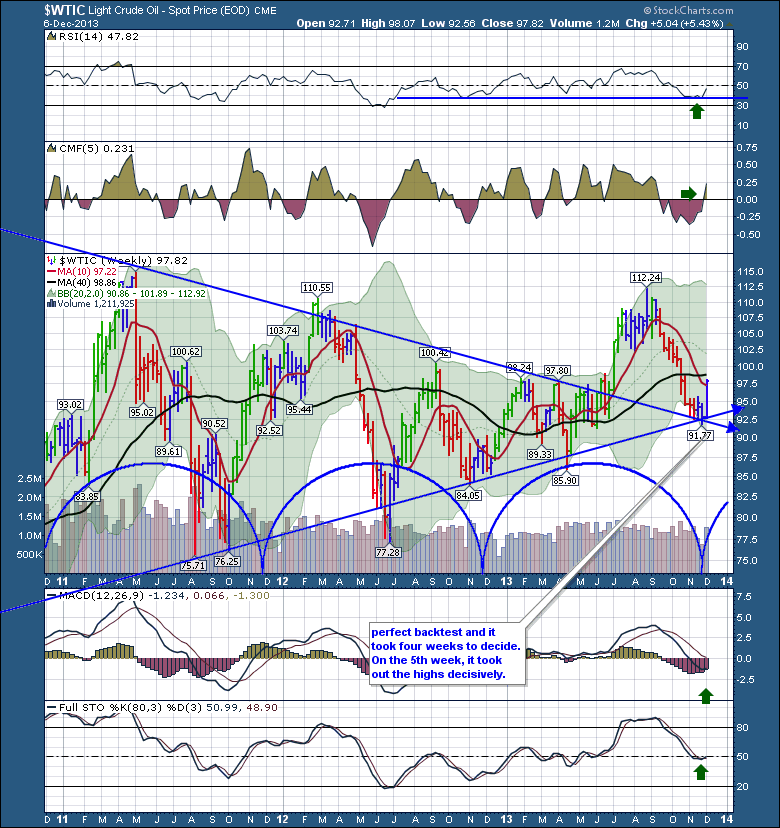
Below is a zoomed in view (A three year weekly view) of the same chart above. You can see how much the price action was behaving based on technical levels.
The RSI found support at the 40 which is a bull trend place to find support. The CMF money flow went positive this week.
You'll notice the price briefly broke below both trend lines and found support. That is probably more important that it tested below and got aggressively bought.
Here is a link to the weekly chart. $WTIC. Change the time period below to see the 7 year view.
It is common to find price break out of a pattern and then go back and backtest the trend line. When it does, that is usually an excellent entry.
So here we sit below the 10 WMA and 40 WMA. On the daily its quite bearish. With the big picture in mind, I think this positive breakout is valid until proven otherwise.Because of the pennant pattern and the breakout with a big week, it gives technicians lots of good choices for stops.
It was only the last Chartwatchers that I though oil would go back up and test the 40 WMA from the bottom. I also wrote that I thought it would would be a major decision point to get back above the 40 WMA. This week's power thrust is pretty bullish. That article is linked here, Is Crude Oil Ready to Rally.
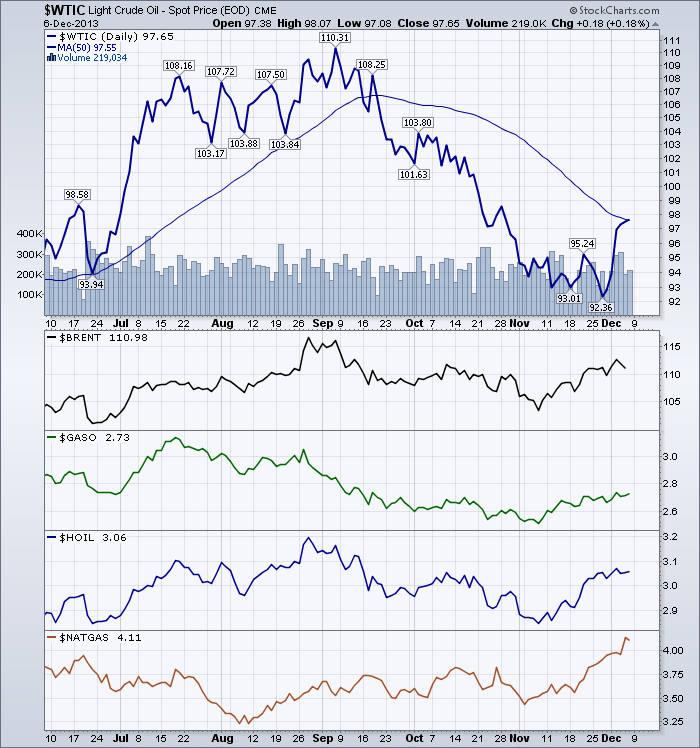
Oil is testing the 50 DMA and the 200 DMA from the bottom right now. But look at all the other energy components since early November. All moving nicely higher.
The live link is here. $WTIC $BRENT $GASO $HOIL $NATGAS
I personally like $NATGAS here as the stocks seem to be rising in tandem with the commodity.
Natural Gas is really one of those quirky products that does not necessarily correlate to the overall business cycle. It really seems able to carve its own price path regardless of currencies, the large equity indexes like the $SPX, as well as other usually related sectors. In times of turbulence it can be an interesting trend to ride.
The refiners have had a good run recently mostly on the back of lower crude. This push up in $WTIC this week was very big which would normally squeeze refiners. But the gas prices have risen to dampen the margin squeeze for the refiners.
This correlated action might be the first indication that these commodities and the related industry groups could finally break out. I am very interested when I see a big move across the board on all these components.
Last week there were no major Canadian energy stocks in the top 25. This week created some interesting turns. Some are really starting to make nice moves higher, contrary to the previous weeks in oil. In isolation, I felt crude might stall below $100. When I see the last months correlated moves of everything going higher, I am ready to get a lot more bullish in this sector.
I have been expecting the $USD to break out to the upside. If the $USD breaks down instead, this group could really benefit. It is still interesting timing for the $USD but it does look like it wants to test lower levels from here. So I am watching how crude behaves at the 50 DMA and the 200 DMA. If we do get a breakout to the upside in $WTIC, this will be a very attractive entry on a substantial portion of oil and gas stocks.
Energy stocks with high SCTR rankings can be an excellent filter to find some big ones moving well.
To get to the main SCTR rankings page, click on the link on the right hand side on the FreeCharts tab.
To get a complete list of various SCTR's just use the drop down menu above the list where is says "S&P 500 Large Cap Stocks". You can choose ETF's, the $TSX, mid cap and small cap stocks.The closer they are to the top of the list, the stronger they are. You can sort by column name to help group stocks by sector together as an example. Scroll down past the ETF's to see the list of energy stocks and their SCTR rankings all on one page! I like to scrolling down to find stocks moving up into an SCTR ranking of between 76 and 81. They still have room for institutions to buy their stock. A visual check of the charts helps with the timely entries.
So I'll be keeping an eye on Oil and the $USD. A break either way will be very important for the Santa Claus rally. If you are trading the Natural gas stocks, they may be less inclined to track the $USD as closely. Remember to book the SCU 101 and SCU 102 Classes in Vancouver and Altanta.
Good trading,
Greg Schnell, CMT


