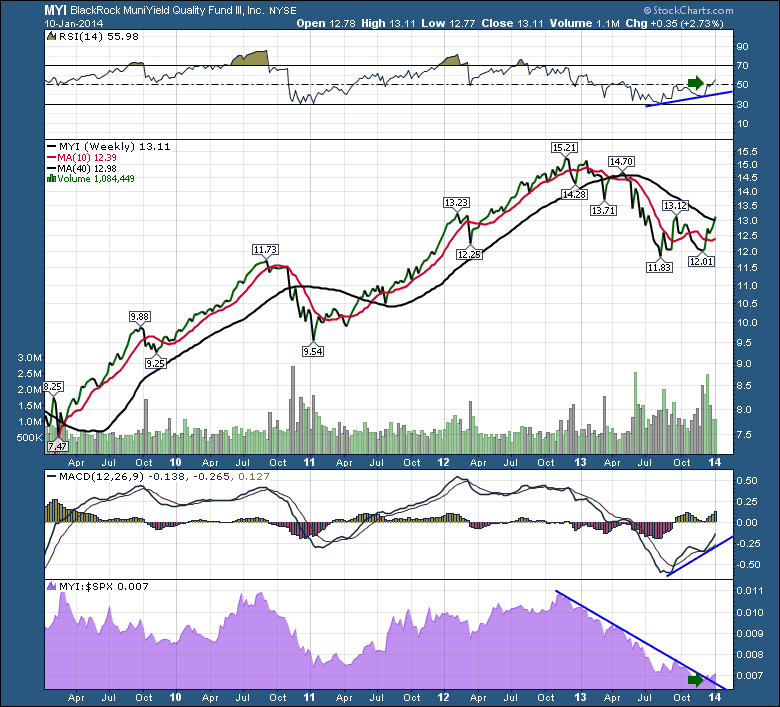
Recently the Municipal Bond ETF started to turn higher. It has been a leading indicator for some of the actual government bond issues.
You can see it has broken above the 40 WMA and has started to turn the MA's from down to flat. We'll see if it can extend.
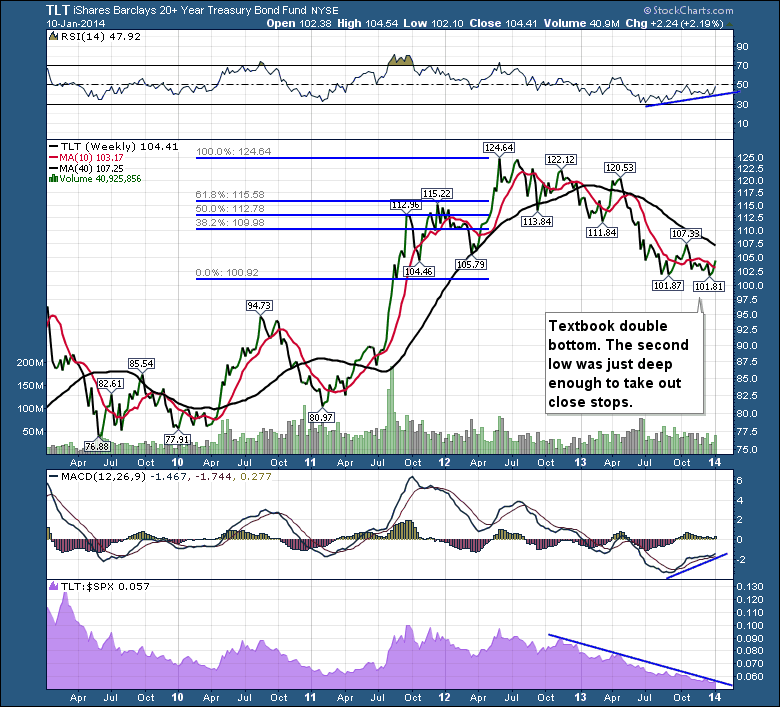
Looking at the TLT ETF on the chart below, we can now look for trend changes here.
So far, we have a textbook double bottom with positive divergence showing up. We are above the 10 WMA. The first target would be the 40 WMA at 107.25 with the follow on targets at the three fibonacci levels of 109, 112, 115.
I would not expect this to rattle the bull market in equities unless this stays above the 40 WMA. At this point, this would be a bear market rally in TLT.
Just one more note. Vancouver SCU 101 and SCU 102 classes still have room if you can make a decision quickly. We talk a lot about the current market conditions for both Canada and the USA using live charts. The actual dates are January 17 and 18th. This will aid professional money managers as well. I hope to see you there! Vancouver link 1/2 way down this information page.
Good trading,
Greg Schnell, CMT


