Signs of a sustainable bull market rally include strong relative performance from financial stocks, especially banks, and rising treasury yields that result from rotation away from treasuries. Both of these areas of the market are flashing warning signs right now, although technical breakdowns to confirm the weakness have not yet been made.
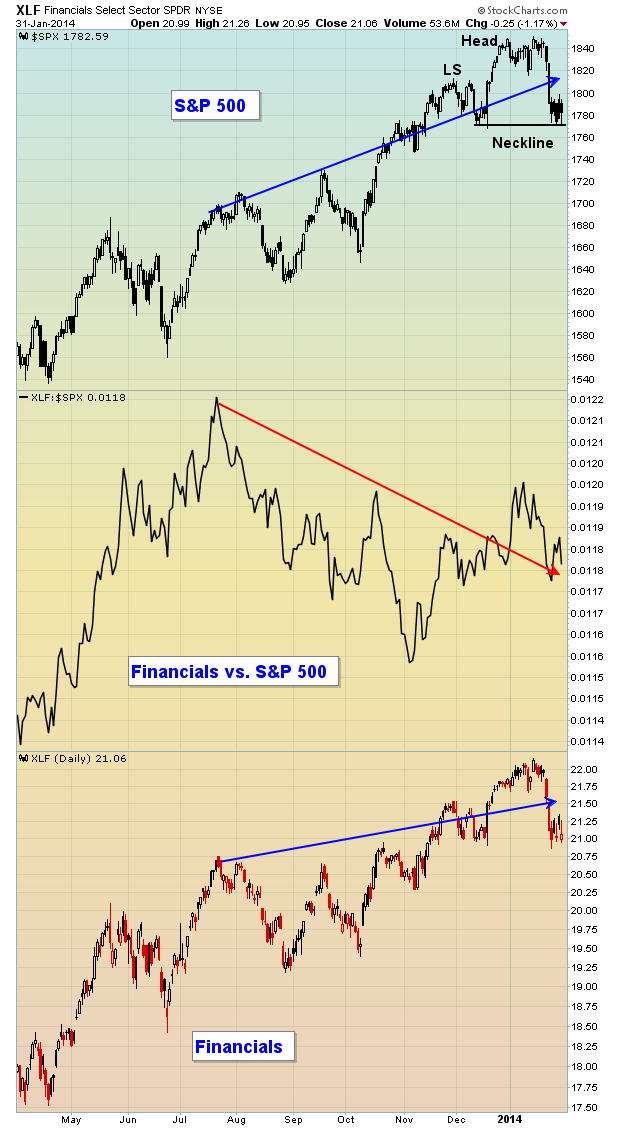
First, let's discuss financials and banks. Below is a chart of the financial sector ETF (XLF) and how it's performed relative to the S&P 500 over the past several months:
The bottom part of this chart shows that the financial sector has been rising and moving to fresh new highs, just like the S&P 500 (top part of chart). But the middle chart shows that, on a relative basis, financials have been lagging since late summer. This indicates that traders are looking to rotate their money away from the financial sector. That money has recently been moving into defensive sectors like utilities and healthcare, both of which have outperformed their aggressive sector counterparts by several percentage points in 2014 thus far.
Also, note that the S&P 500 could be in the process of forming a topping head & shoulders formation. A close below 1770-1775 on the S&P 500 with increasing volume would suggest a downside target/measurement somewhere in the 1690-1700 area.
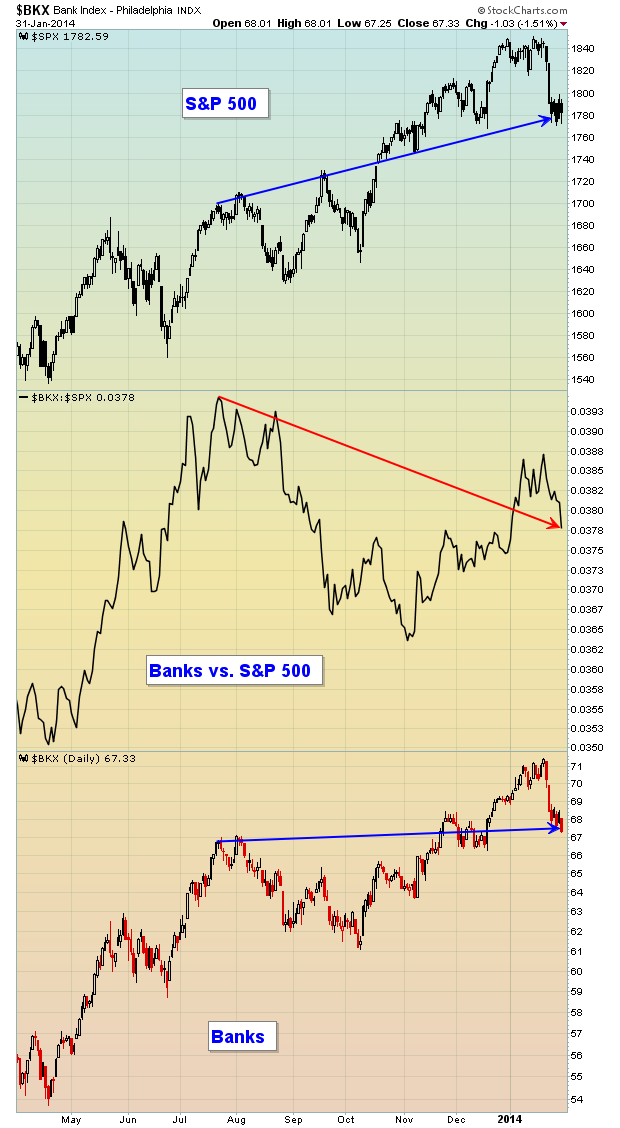
The next chart below features the Bank Index ($BKX) and you can once again see that the relative strength in this group is lacking. It's generally a good sign to see banks performing at least at the level of the S&P 500. When they begin to lag, it potentially sends a warning signal about the sustainability of a stock market rally. A strengthening economy should bolster bank profits so the BKX should rise if such an economy is anticipated. Check out the BKX below:
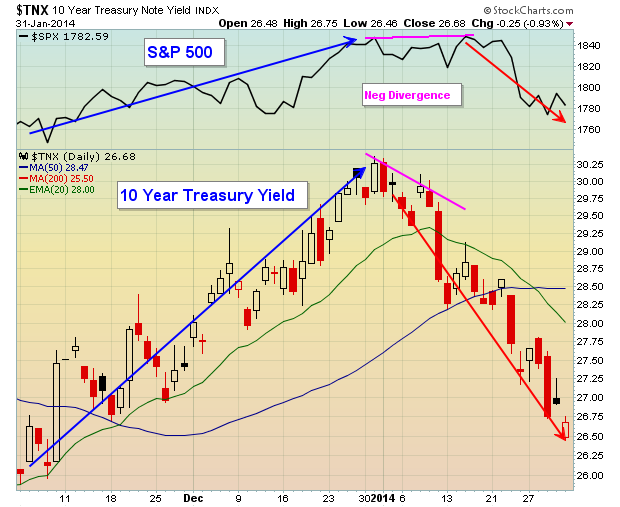
Finally, let's take a look at the 10 year treasury yield ($TNX):
Traders have a choice whether to invest for income (treasuries) or growth (stocks). If they choose safety and income, they buy treasuries - treasury prices move higher and the yield moves inversely, or lower. By buying treasuries, those dollars cannot also buy equities. The fact that demand slows on equities sends stock market prices lower. So when treasuries are in favor, yields AND equity prices drop. But many times in the past, you'll find that yields begin dropping before equity prices, providing astute traders with a potential warning sign regarding an impending drop in equities.
Take a look at that 10 year treasury yield chart again now. Note that the S&P 500 tried breaking to fresh highs in mid-January, but did so with the yield dropping. In my view, that's a form of a negative divergence from an intermarket perspective. The precipitous drop in yields occurred just before a significant decline in equities.
If you're bullish the stock market over the longer-term, which I still am for now, you'll want to see strengthening relative performance on banks and rotation OUT of treasuries, sending yields higher to challenge and eventually surpass the yield at the start of 2014. In the near-term, however, please watch that head & shoulders pattern for possible breakdown. Should the neckline support fail to hold, we could be looking at more weakness in February before technicals begin to improve.
Enjoy the Super Bowl and Happy Trading!
Tom Bowley
Chief Market Strategist
Invested Central


