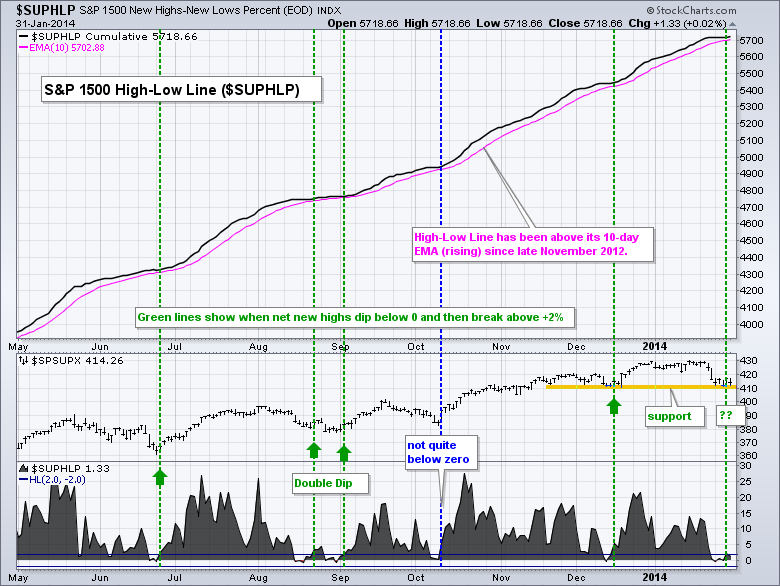
High-Low Percent for the S&P 1500 dipped into negative territory in late January. This is potentially significant because prior dips did not extend past the -2% level and marked turning points in the S&P 1500. The chart below shows the S&P 1500 High-Low Line ($SUPHLP) in the main window and High-Low Percent in the bottom window. High-Low Percent equals new highs less new lows divided by total issues. The High-Low Line is a cumulative measure of High-Low Percent. First, notice that the High-Low Line has been above its 10-day EMA (rising) since November 2012. This is an extraordinarily long time and indicative of a strong uptrend. The last flattening occurred in late August.
Click this image for a live chart
Turning to High-Low Percent, notice how this indicator dipped into negative territory in late June, mid-late August and mid December. The indicator almost dipped into negative territory in early October, but not quite. Subsequent dips and moves back above +2% provided opportunities to partake in the long-term uptrend. In other words, a dip to the zero line signaled a correction within the uptrend. Another bullish signal triggered this week as High-Low Percent dipped into negative territory and then moved back above 2% on Thursday. Before getting too bullish, notice that there was a double dip in August as the market produced one more leg lower during the August correction. This is not a stand-alone signal and should be used in conjunction with other aspect of technical analysis, such a chart patterns and momentum indicators. Note that StockCharts calculates and provides breadth data for over a dozen indices and sector SPDRs.
Good trading, good weekend and great football!
--Arthur Hill CMT


