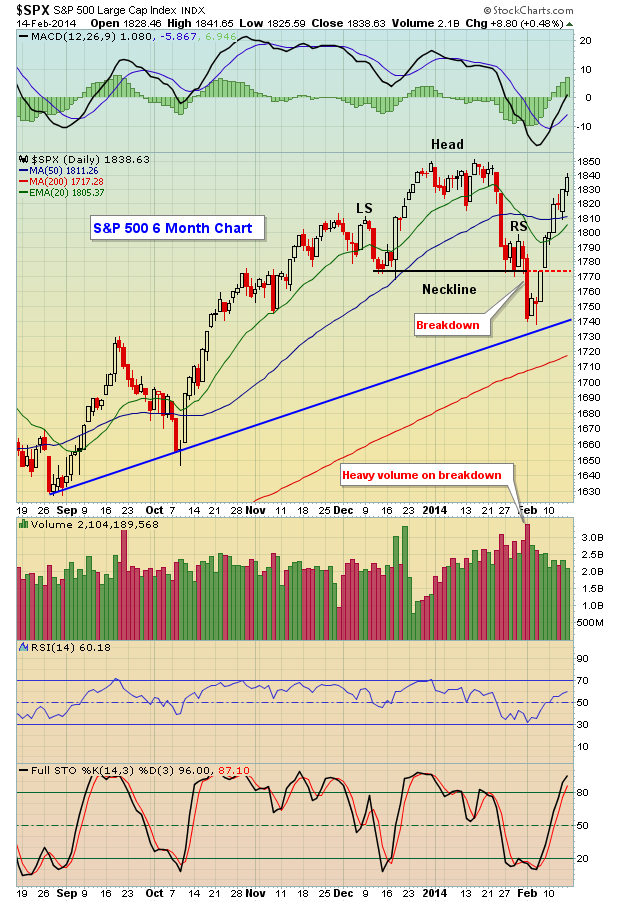
Just two weeks ago, the stock market seemed on the verge of its first correction in a long time - all within the confines of a long-term bull market that began in March 2009. Then came the breakdown I was looking for to confirm it. Check out the head & shoulders breakdown that occurred earlier this month on the S&P 500:
Generally speaking, confirmed head & shoulders patterns that lose neckline support on very heavy volume don't usually move right back through what should become solid price resistance at that neckline. Yet that's exactly what the S&P 500 did - it lost neckline support, then regained it almost as fast as it had lost it. Volume on the recovery was much lighter as well.
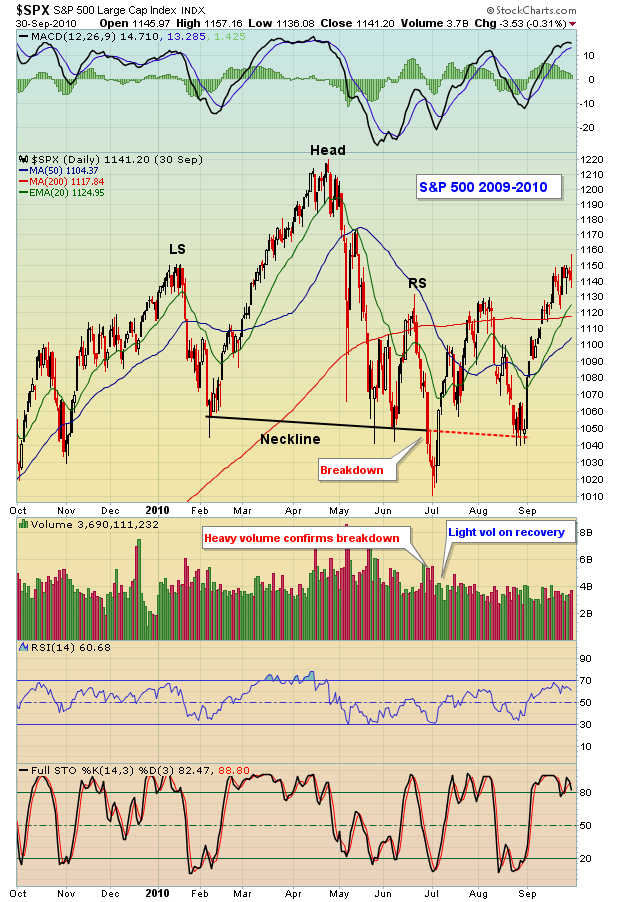
As traders, we must respect these ugly bearish breakdowns. But we must also swallow our pride when the pattern resistance fails to hold back the bulls. The reason? There's a long-term bull market in play and sitting on the tracks as the bull market freight train approaches is the equivalent of financial suicide. Let's go back into recent history and I'll show you a previous example where I was prepping for the worst just as the market bottomed. Take a look at June 2010:
It was another false head & shoulders top and I had to quickly admit my mistake and be prepared to follow the bull market higher.
So the bottom line is that I'm treating this bull market as though it remains in full force. There are still issues that remain, so I wouldn't commit all my capital to the long side. It certainly appeared to me as if a corrective phase had begun just a couple weeks ago given the high volume breakdown of a bearish head & shoulders pattern. And the relative weakness in financials, especially banks, and relative strength in treasuries both argued for lower equity prices as well. One thing I've learned over the years, though, is don't question a bull market too often or for too long.
Given these mixed signals, how's the best way to approach the market? Well, I was looking for a short-term correction only so I still like longer-term money remaining fully invested. I like to swing trade, however, so I'd keep position sizes fairly light, maintain a comfortable level of cash and trade primarily on the long side. I'd look for companies that beat Wall Street top line and bottom line estimates and wait for solid reward to risk entry points. Recently, I've mentioned candidates like Charles Schwab (SCHW), Alcoa (AA) and Lennar (LEN). They've all performed quite well on a relative basis and, with patience, all hit nice solid support levels.
I'll feature another company with solid revenues and earnings as my Chart of the Day for Monday, February 17th. CLICK HERE for more details.


