ChartWatchers April 19, 2014 at 08:46 PM
Last week's gains may have been more about options expiration and an oversold bounce than anything else... Read More
ChartWatchers April 19, 2014 at 02:16 PM
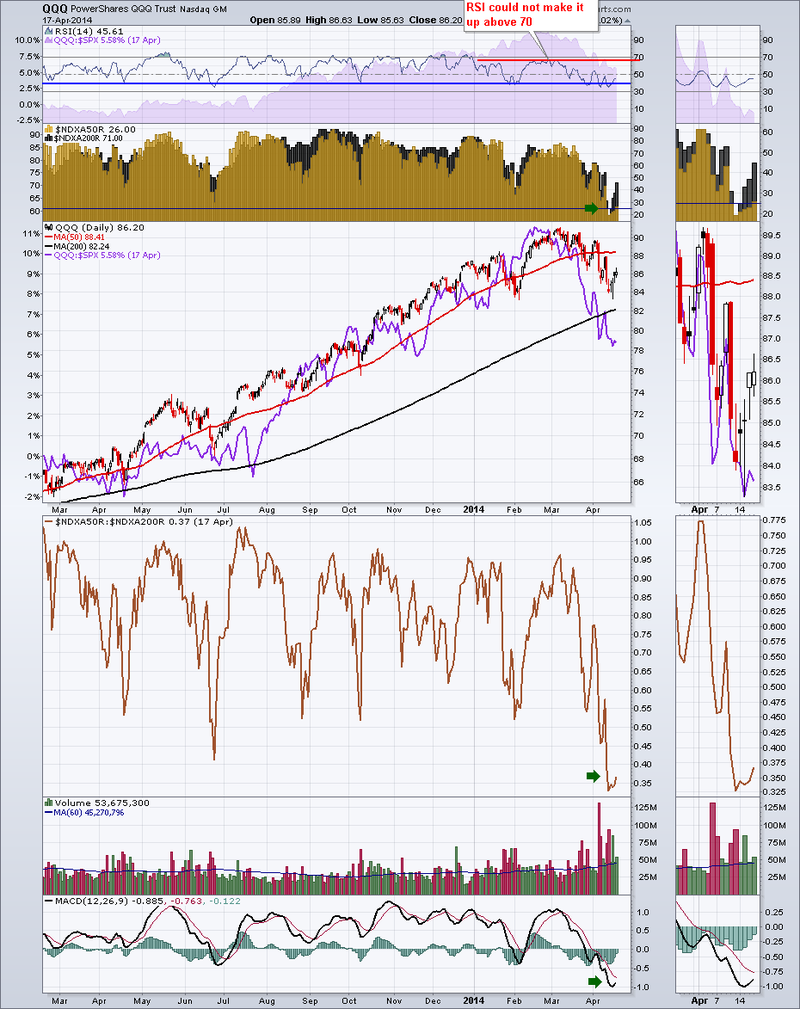
The QQQ is the tracking ETF for the Nasdaq 100. It has lots of messages this week. Other indicators also exist for the Nasdaq 100. The $NDXA50R is a sweet indicator. Its even better paired with its mate the $NDXA200R... Read More
ChartWatchers April 19, 2014 at 12:18 PM
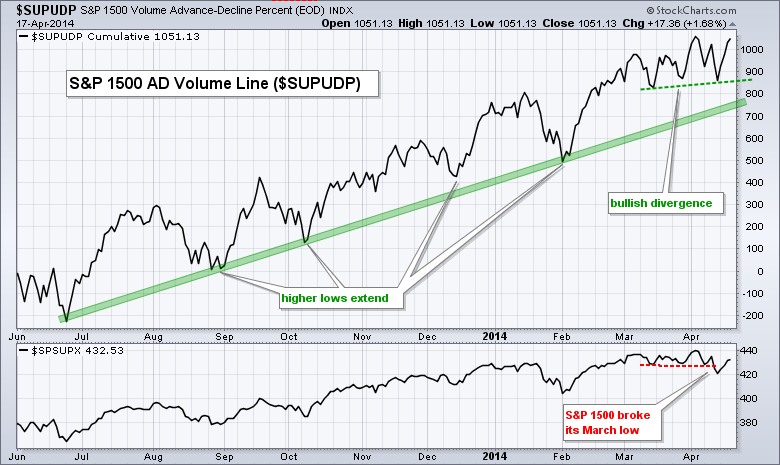
The AD Volume Line held strong during the April pullback and formed a small bullish divergence over the last few weeks. The AD Volume Line is a cumulative measure of AD Volume Percent, which is advancing volume less declining volume divided by total volume... Read More
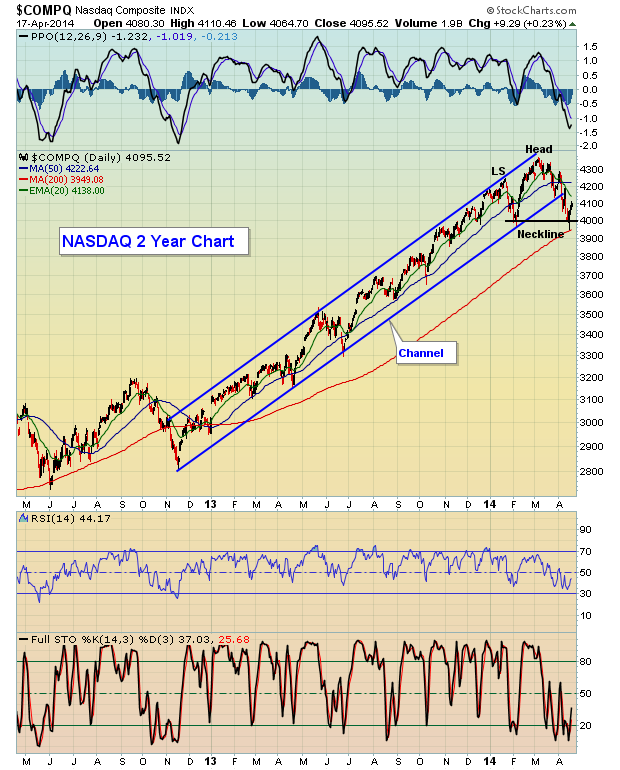
ChartWatchers April 19, 2014 at 03:59 AM

Hello Fellow ChartWatchers! After a couple of big down days, the market had 3 nice up days in the middle of the week to retest the 16450 level on the Dow before closing mixed on Thursday just before the Good Friday holiday... Read More
ChartWatchers April 06, 2014 at 02:47 AM
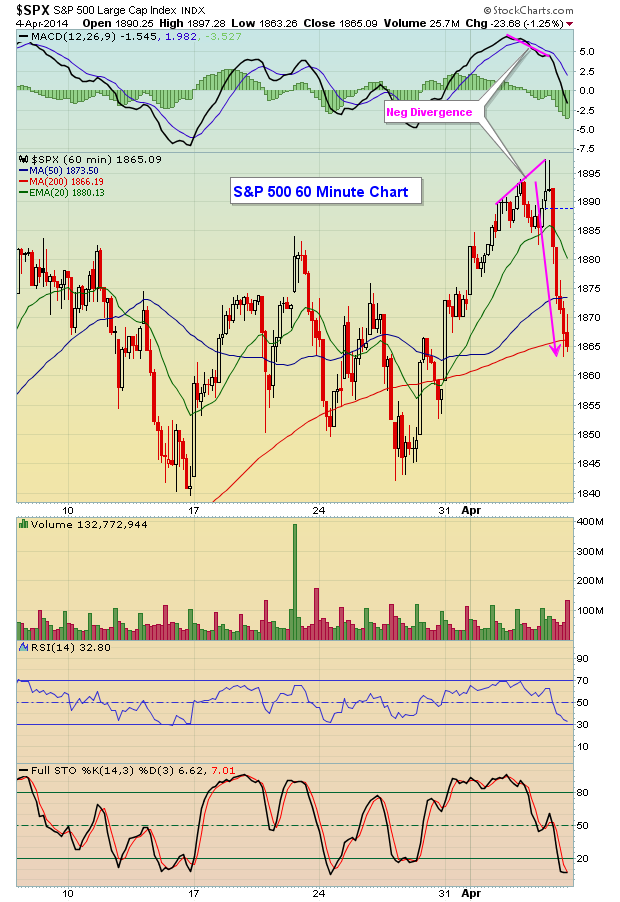
Hello Fellow ChartWatchers! If you are looking for lots of near-term optimism, I'm afraid the rest of this newsletter will be very disappointing. There are numerous technical reasons to think the market is overdue for a pull-back. And here they are..... Read More
ChartWatchers April 06, 2014 at 02:00 AM
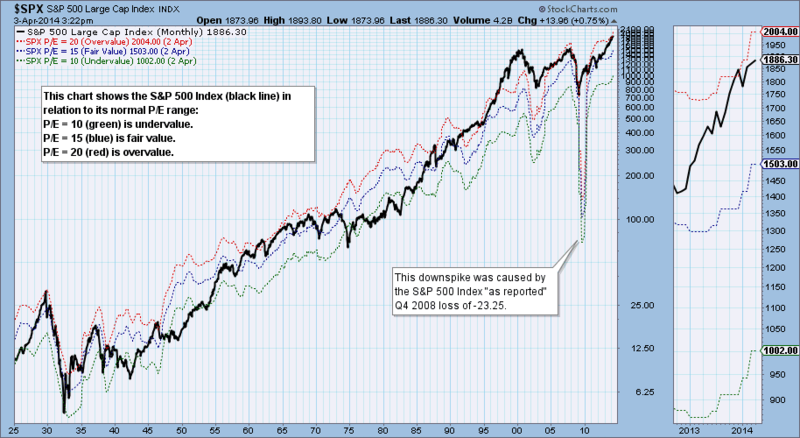
On any given day we can find a wide range of opinions as to whether the stock market is undervalued or overvalued, and the bases for these assessments are also wide ranging and sometimes overly optimistic... Read More
ChartWatchers April 06, 2014 at 02:00 AM
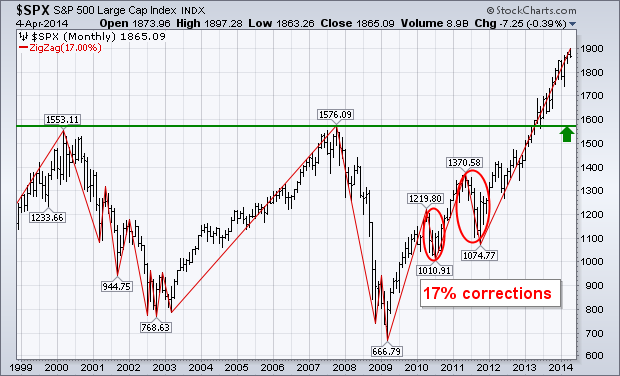
Last December 14 I wrote a message warning of the likelihood of a market correction during 2014. Midterm election years are the most dangerous of the four-year presidential cycle. ["The Four Year Presidential Cycle Suggests That 2014 Could Suffer a Major Downside Correction..... Read More
ChartWatchers April 06, 2014 at 01:52 AM
In earlier 2014 articles, I've discussed warning signs that emerged from Volatility indices, behavior in the treasury market, relative weakness of banks and relative strength of defensive areas of the market like utilities and REITs... Read More
ChartWatchers April 05, 2014 at 06:36 PM
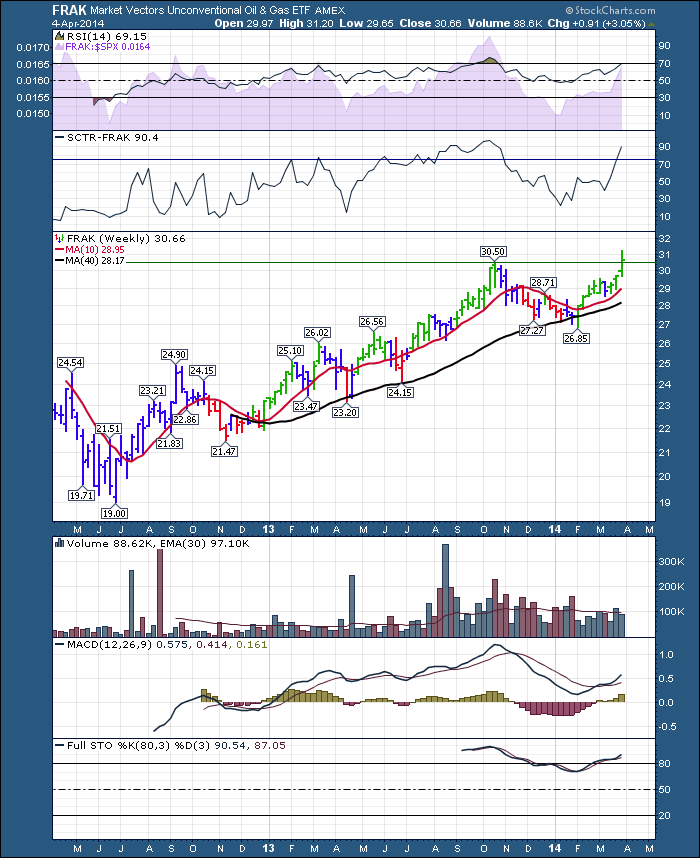
FRAK is an Unconventional Oil and Gas ETF. It spurred up to new 2 year highs this week and closed above the previous high. While it did pull back on Friday, this chart suggest a renewed push into these plays... Read More
ChartWatchers April 05, 2014 at 01:04 PM
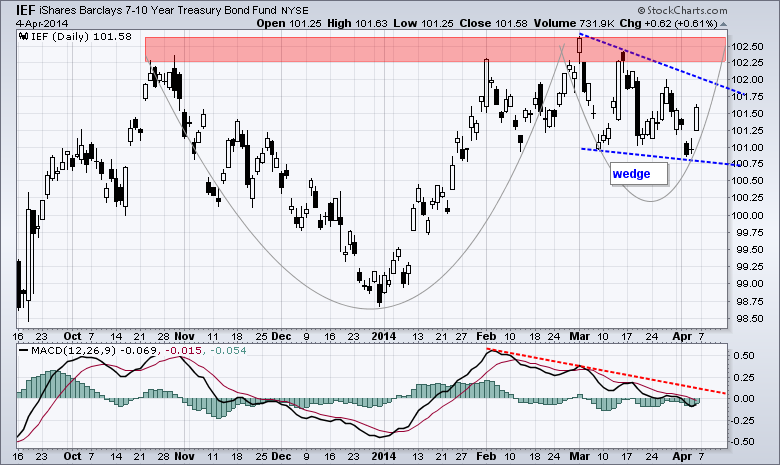
The 7-10 YR T-Bond ETF (IEF) is tracing out two potentially bullish patterns and chartists should watch these patterns for clues on the stock market. The chart below shows IEF hitting resistance in the 102.25-102.5 area and then correcting with a falling wedge... Read More
ChartWatchers April 04, 2014 at 10:12 PM
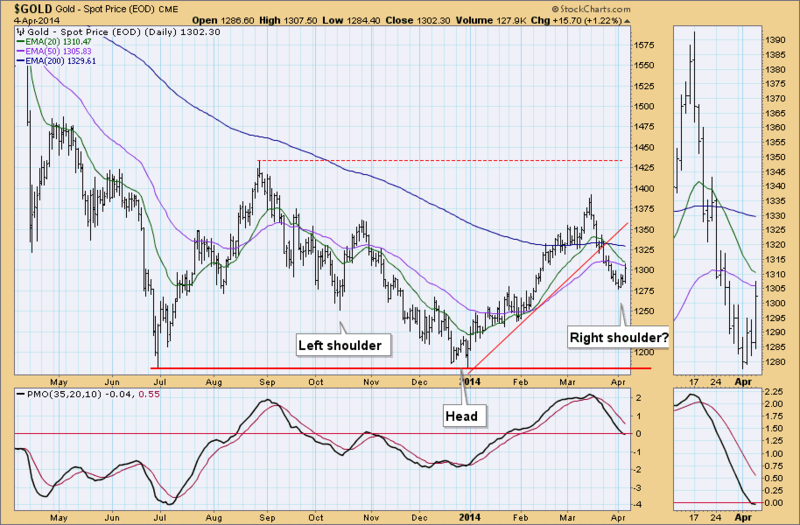
While I was reviewing the Gold daily 1-year chart, I noticed after Friday's close that we could be looking at a bullish reverse head and shoulders pattern forming up. I've annotated what I view as a left shoulder and head along with where we would look for a right shoulder... Read More