In 2013, market participants couldn't get enough of cyclicals, or consumer discretionary stocks. The XLY (ETF that tracks consumer discretionary) rose more than 40% in 2013 to lead all sectors on a relative basis. But things have changed in 2014, with many of the strong industry groups in 2013 lagging badly in 2014. A prime example is the Dow Jones US Business Training & Employment Agencies index ($DJUSBE). Take a look at how quickly this industry group has fallen from power:
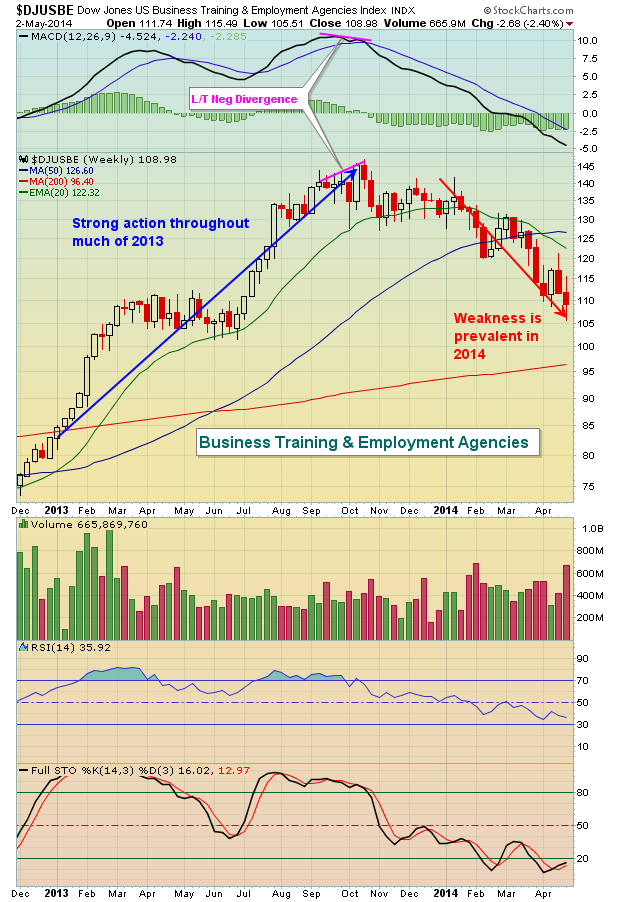
Fundamentally, it doesn't make a lot of sense. Didn't the government just report a resurgence in jobs on Friday? You'd certainly think that business training and employment agencies would benefit from a strengthening jobs picture, right? So what does the reaction to the jobs report tell us as the DJUSBE closes at yet another weekly low? It tells me to remain very cautious and not to believe the breakout threat on the Dow Jones and S&P 500. The declining 10 year treasury yield ($TNX) tells me the same thing. If the bond market doesn't believe the government report, then neither do I.
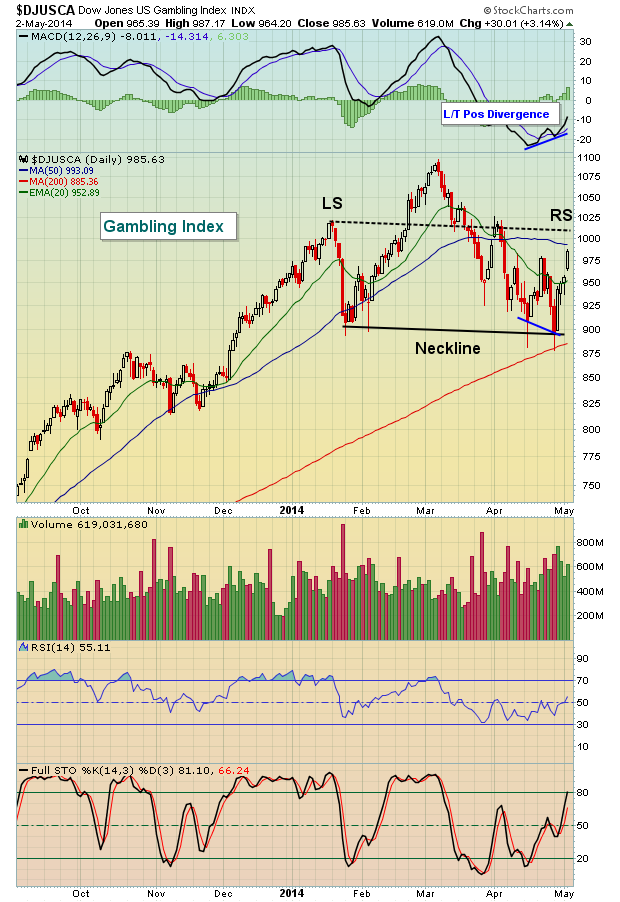
While the DJUSBE has been an obvious laggard among cyclicals in 2014, there's another consumer discretionary group where the storm clouds are beginning to gather. Gambling. We haven't seen a breakdown in this space yet, but the warning signs and topping pattern are clear. First off, last Monday's low printed a right side of a potential neckline that is downsloping from the left side of the neckline. That gives this head & shoulders topping pattern a more bearish feel. Last week's bounce in this group was strong no doubt with heavy volume. This chart is worthy of watching, however, as we await to see whether the 1025 resistance level (left shoulder) can be negotiated prior to a break of neckline support near 900. The latter would be very bearish for gambling stocks. Check out the potential head & shoulders topping pattern:
Historically, the end of April and first week of May tend to be strong and we saw that reflected last week. The same cannot be said for the next 3 weeks that follow, though. On the S&P 500 since 1950, the period from the May 5th close to the May 25th close has produced an annualized return of MINUS 15%. That's 24 percentage points below the average annualized return throughout the year of 9%. Some of this historical weakness could be attributed to profit taking as earnings season winds down. Call it what you will, but seasonal patterns begin to favor the bears after Monday's close and that will simply add to many of the technical warning signs I've discussed the past few months.
One gambling stock showing a bearish head & shoulders topping formation is our Chart of the Day for Monday, May 5th. You can learn more by CLICKING HERE.


