Hello Fellow ChartWathcers!
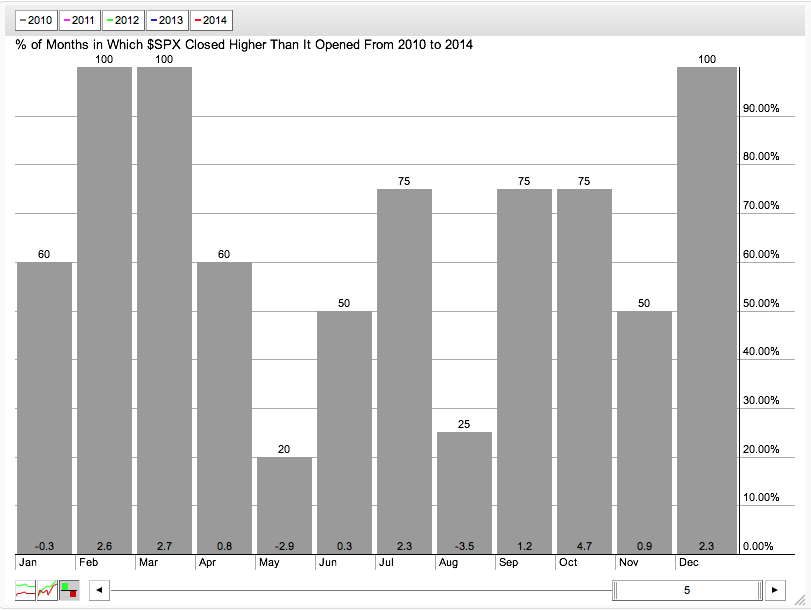
April ended on a fairly positive note with all of the major US average up about 1% for the week. That comes as we head into what has been - at least over the last 5 years - the worst month of the year for the S&P 500. Courtesy of our Seasonality charting tool, here is the phrase "Sell in May and go away" pictured in one chart:
So, to offset (partly) that not-so-cheery news, I thought I tell you about our latest addition to StockCharts.com - the DecisionPoint Tracker Reports!
Tracking Down Great Stocks with DP Trackers
For several decades now, Carl Swenlin - the driving force behind DecisionPoint's timing models - has been generating a prodigous amount of technical data about the markets and the popular stocks and ETFs that make up the market. He has been making those reports available to his members for years. Now, with the merger of DecisionPoint and StockCharts.com, those same reports are now availble to all StockCharts members!
Every day Carl's spreadsheet models crank out 14 specialized reports that summarize and rank 14 important collections of stocks and ETFs. He calls those his "Tracker" reports. Here is a list of each of the different DP Tracker reports:
- DecisionPoint ETF Tracker - 100 of the most important US ETFs
- DecisionPoint ETF Lite Tracker - 30 of the most important US ETFs (in case 100 is too many)
- DecisionPoint SPX Trackers - Six different reports that cover all of the stocks in the S&P 500
- DecisionPoint 152 Blue Chip Tracker - One report contains all stocks in DJIA, DJTA, DJUA, S&P 100 as well as several important Nasdaq large caps. This is my personal favorite (and not just because it has my name in it!).
- DecisionPoint Dow Jones US Sector Tracker - Rankings for the various Dow Jones Industry Indexes
- DecisionPoint Dow Jones 65 Tracker - Rankings for stocks in the Dow Jones 65 Index
- DecisionPoint NDX Tracker - Rankings for stocks in the Nasdaq 100 Index
- DecisionPoint OEX Tracker - Rankings for stocks in the S&P 100 Index
- DecisionPoint Dow 30 Tracker - (You guessed it) Rankings for stocks in the Dow Jones Industrial Average.
All DP Tracker reports provide their information in the same general format. Here is the organization for a typical DP Tacker report:
- A list of all the stocks in the report sorted by name along with their closing price, change, percent change, percent average daily volume, yeild, P/E ratio, and payout ratio. All the symbols are linked to their corresponding SharpChart as well.
- That same list sorted by percent change so you can quickly see the big movers.
- That same list sorted by percent average daily volume so you can quickly see which stocks had unusually high or low volume.
- That same list sorted by yield.
- That same list sorted by P/E ratio.
- (Now it gets interesting...) The list of stocks sorted by DecisionPoint's PMO Rank calculations. This table shows which stocks have the top PMO Rank as well as how that rank has changed over the past 5 and 15 days. It also has a collection of "+" and "-" symbols that Carl calls "Hot/Cold Blinkers." Those are too cool for me to explain here but Carl includes an explanation at the bottom of the Tracker report.
- A report about PMO Crossover signals for that group of stocks.
- A report about how that group of stocks is doing if you were trading them mechanically using Carl's Price Momentum Model. To be clear, we don't recommend mechanical trading but you can use these signals to assess the overall health of the market and the various sectors/industries in the market.
- And finally, a report comparing long-term and short-term PMO signals.
Phew! So what do these things actually look like? Here's a sample screenshot:
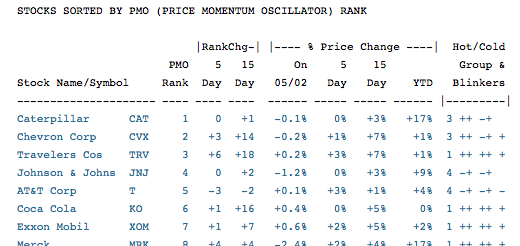
Now, reading DP Trackers is kind of like shopping at your local supermarket. You don't have to buy (i.e., read) everything in every report to get value. You might spend a little time up front reviewing all of the reports but you will soon discover that only one or two of them require your continued attention. And then, within each report you will soon see that only 1 or 2 sections of the report might be what you want to study closely. So, over time, you will probably develop the ability to find the key data you need very quickly.
So, now that I've piqued your interest, where can you find these amazing reports? In the new "DP Trackers" blog of course. Every day after the market closes, we will be added 14 new articles to that blog - one for each Tracker report. You can now find a link to that blog on the right side of the "Members" page. Or you can just click here to go to the DP Trackers blog.
Here are some things to remember about using DP Trackers:
- They are only available to StockCharts.com members.
- They are updated every day about two hours after the market closes.
- They are not meant to be used as real-life buy/sell signals. The onus remains on you to determine what/when to buy or sell.
- We will be adding articles in the new future to the DecisionPoint blog about how to use and interpret these reports in more advanced ways.
Notes for existing DecisionPoint.com users:
- We will soon be adding links to the associated Tracker spreadsheets to each Tracker report.
- We will soon be adding the various DecisionPoint Reports (DP Alert, etc.) to our website in a similar manner.
- Unlike on the original website, we will be archiving these Tracker reports so you can go back in time and see what things looked like in the past.
Notes to people from the future:
- In the future, we hope to make these reports easier to navigate and customize.
- In the future, we will have ChartSchool articles explaining all of the concepts in more detail.
- In the future, we will let you see more of this information directly on our charts.
- In the future, you will be able to scan most of the information in these reports.
- In the (near) future, Erin will write some more articles on how to use and interpret these reports.
Until then however, please enjoy this huge new addition to StockCharts.com!
- Chip


