$LUMBER is a rarely watched indicator relative to $COPPER, $GOLD, and $WTIC. But Lumber is a valuable signalling tool.
Let's pull up the long term chart and discuss why. I want to spend a minute on the RSI because this chart is a classic with respect to Constance Browns work on the RSI. First of all Ms. Brown discovered that Bull markets oscillate between 40 and 90 and Bear markets oscillate between 10 and 65. Starting on the left, during the entire downtrend in 2006, 2007 and 2008, the RSI stayed in bear territory as shown by the Red line. After climbing above 40 in April of 2009, the RSI pushed up into bull market territory in November 2009. The trend had changed. Oops, the flash crash of 2010 in the equity markets sent $LUMBER into a tail spin. The RSI fell below 40 marking a potential bear market again. At point "A", that bear market signal was cancelled by the RSI returning to 70. The RSI stayed in the green bull mode until May 2013. Then it went down and touched 30. This was a significant warning that things could be changing. On the next rally, the RSI was unable to thrust back up into bull market territory and stalled at 60. Recently it was unable to get back above 50 which is very bearish. Even in the bear market rallies of 2007 and 2008 in the midst of the Sub Prime crisis, the rallies pushed up to 60. So the RSI points to a bear market rally in the fourth quarter of 2013. It could break higher and become a new bull market, but it makes us acutely aware now that two of the conditions have been met. 1) a trip below the 40 level in June of 2013. 2) A Failure to get back above the 65 level.
Let's look at the price chart. In 2006, $LUMBER was declining long before the market top. The lower highs and lower lows of the lumber price into July 2007 was a real confirmation of what we just covered on the RSI. While the RSI had the cap of 60 on it through 2006, 2007 and 2008, the Lumber price kept moving in a down trend with lower highs and lower lows. The March 2009 lows in Lumber were higher than the January 2009 lows. Easy to look back and know that March 2009 was the bottom. At the time it was pretty unnerving. Once the 2009 lows were in, lumber made a series of rising lows. The 2010 low was extremely 'V' shaped. The 2011 market crushed commodities in general in the March 2011 timeframe. Lumber plummeted but based at a much higher low. It made a 9 month base and powered higher. In October 2012, after the Fed launched the $85 billion per month QE, lumber soared to new highs. In the October / December 2013 time frame, lumber made a lower high. This was after the RSI had dropped all the way to 30 on the recent low so there was a warning. Now the price sits at the up sloping trend line as well as 7 years of horizontal support/resistance. This is an extremely critical place on the chart and the RSI suggests the highs are already in. Lets look at the PPO now.
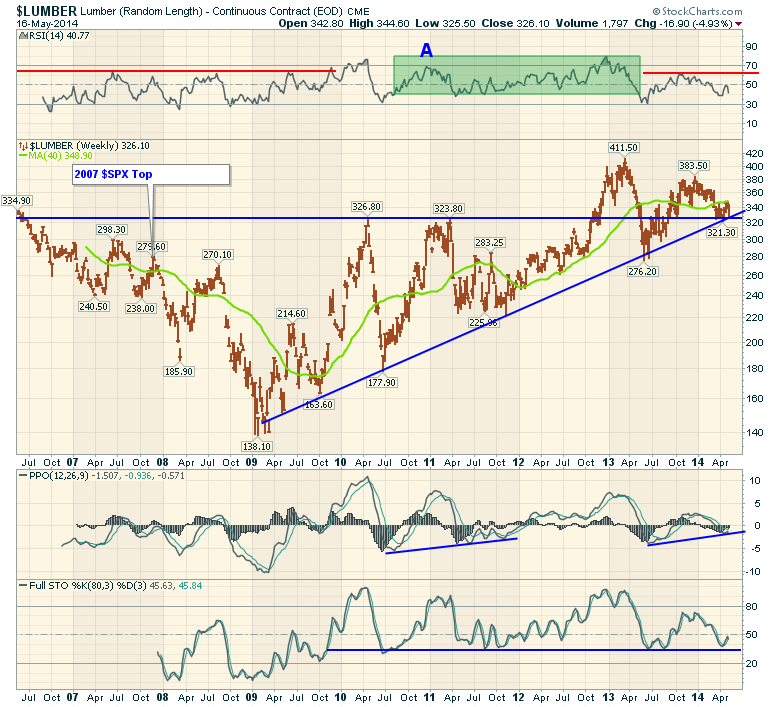
The PPO is just below zero and this is similar to how it based back in 2011. It really needs to find some strength here. The PPO is like the MACD but uses percentage to neutralize the change in price on the long term chart. So the only signal PPO is giving us is that it has fallen below zero. The pattern is similar to October 2007 and June 2011 with a lower previous low and now trying to make a higher low. In 2007 it failed at the zero line around December 2007 and started a series of lower lows.
The Long interval full stochastics are good for major trends. We can see that since the bull market started the 35-40 level has held. Recently we bounced off it again. That looks bullish. We need to see these long term levels break out to higher highs.
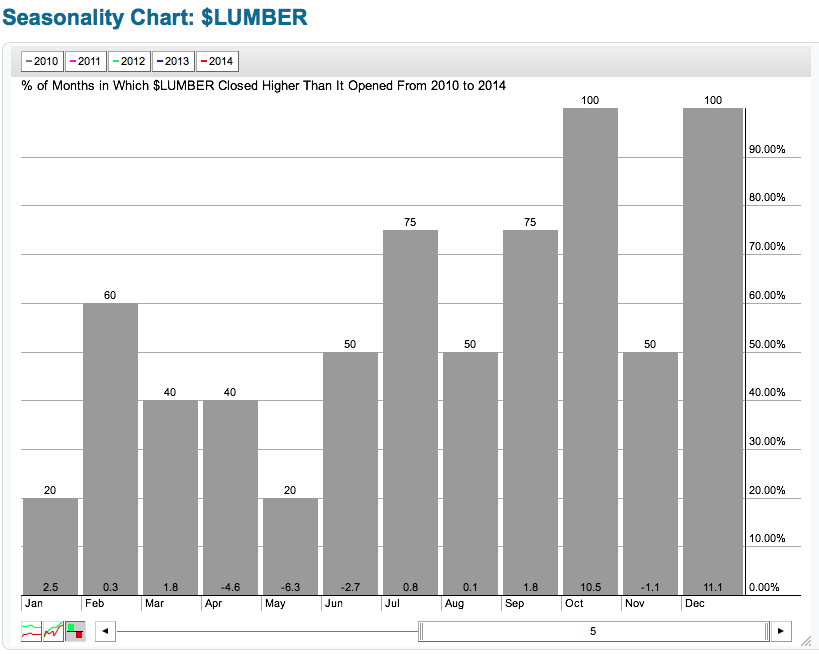
In almost every year, the $LUMBER price was in a downtrend for April May. The seasonality chart shows $LUMBER closed higher than it opened the month of May only once in five years (20%) in a big bull market.
To conclude, the big picture looks damaged but not irreversible here. If lumber can find support at the trend lines and continue higher, it just makes both of those trend lines more important for the future. Should they both fail to support lumber, we would have a very important clue that bigger problems are starting to show up in the home construction industry and probably the broader economy. Lumber declines were very early in 2006 and 2007 relative to the equity markets. We are now holding some clues from 2013 and the first half of 2014. We'll need to see this turn signifcantly higher soon to take our worries away. If it does turn up, we might see the homebuilders make a push up as well.
Good trading,
Greg Schnell, CMT
