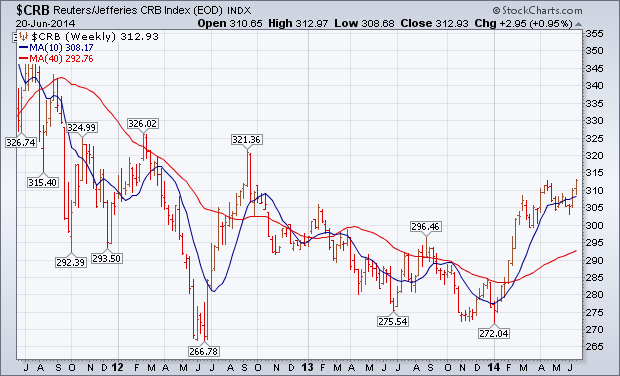
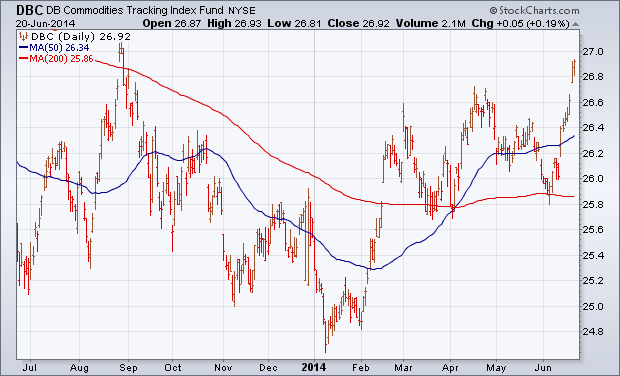
The weekly bars in Chart 1 show the Reuters/Jefferies CRB Index closing at the highest level since the third quarter of 2012. [The CRB Index includes 19 commodities that are traded on exchanges in the U.S. and U.K.]. Commodity prices turned up during the first quarter of 2014 for the first time in two years. After consolidating during the second quarter, they appear to be regaining upward momentum. Energy prices spiked higher the previous week on increased tensions in Iraq. Precious metals jumped sharply this week. That might also be the result of increased global tensions. This week's jump in precious metals may also be the result of a jump in U.S. consumer prices to the fastest pace in a year combined with the Fed decision to keep rates low for an extended period of time. The daily bars in Chart 2 show the DB Commodities Tracking Fund (DBC) surging to the highest level since last August. That helped make commodities the week's strongest asset class. A weaker dollar also helped.