Natural Gas ($NATGAS) has been moving higher every week for three weeks now. As we head into the cooling season for air conditioning, it might be timely to stay in tune with the producers of Natural Gas.
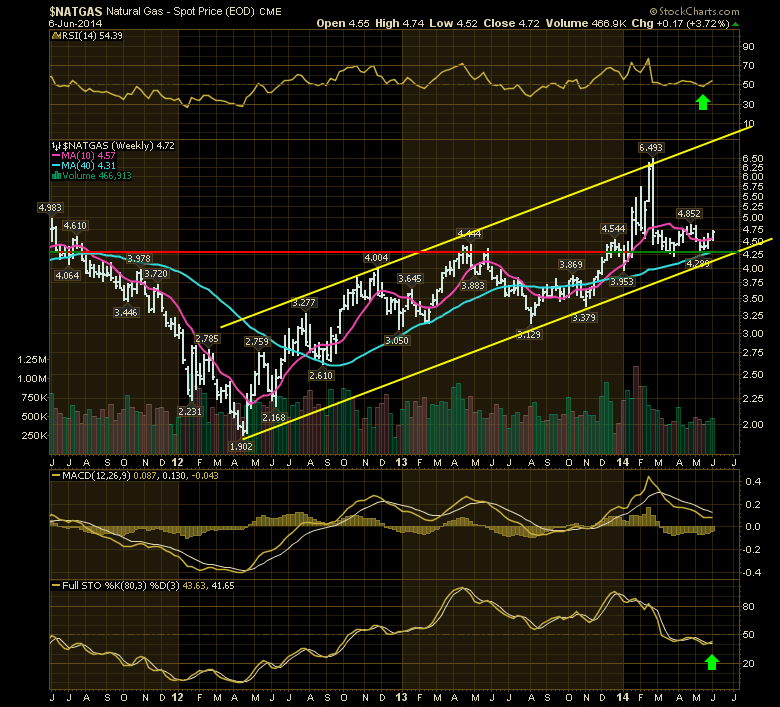
A few things make this particular turn compelling. While the RSI is back above 50 and the long period Full Stochastics have crossed the signal line, there is one more feature on the chart that is compelling.
After having a significant moon shot on the chart in February, the Natural Gas chart pulled back. The best part was it found support at the previous resistance line shown in red and this has now become support - green!
The summer weather forecast I heard this week was for the three coastal regions to have above average heat and the interior like Montana and the Dakotas to have more moderate temperatures. If that is true, then the low inventory levels shown below on Natural Gas makes the story more compelling. The air conditioning draw on Natural Gas can be huge especially if the major population regions are all experiencing higher than average energy use.
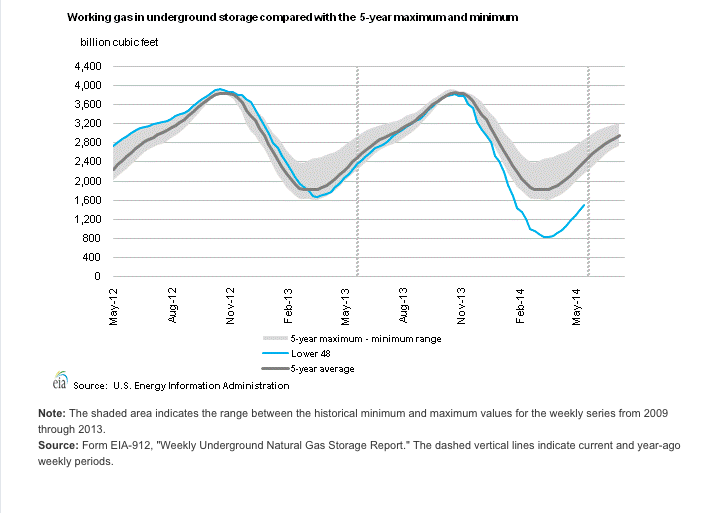
Source: US Energy Information Administration.
We are almost 900 Billion cubic feet under the 5 year average for storage levels, and well behind last years as well. Higher prices will focus the energy sector on drilling for Natural Gas and bringing in online quickly. The above average cooling season demand should help moderate that inventory recovery making the stimulus for Natural Gas production more compelling than normal.
Natural Gas reservoirs deplete quite quickly so it is a consistent challenge to stay ahead of last years production as each year old wells produce less on average. So you need to have new wells coming on stream to stay even and you need to drill lots of new wells to make up a big North America wide inventory shortfall. This should also help the drillers and frackers with demand for their services.
Good trading,
Greg Schnell, CMT


