This week was an important week on a lot of the commodity charts. Most of them surged up to major long term resistance lines with a few of them breaking through.
But it is the Euro Currency Charts that look critical right here. If major support should fail on the Euro ($XEU) , that would indicate a rise in the US Dollar ($USD). A major push in the $USD usually has downward pressure on commodity prices.
Lets look Monthly, Weekly and Daily to see the full picture.We can see on the Monthly, the Euro recently peaked out at a key long term support resistance area. After pushing up against the down sloping green resistance line it has pulled back and is testing the 2 year up sloping blue line.
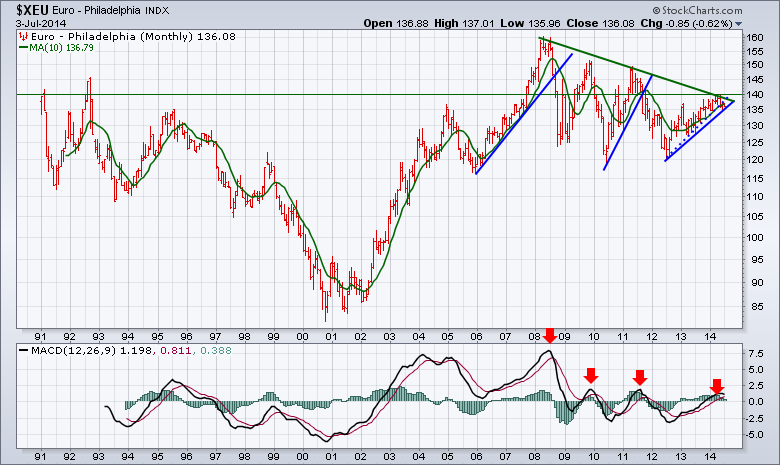
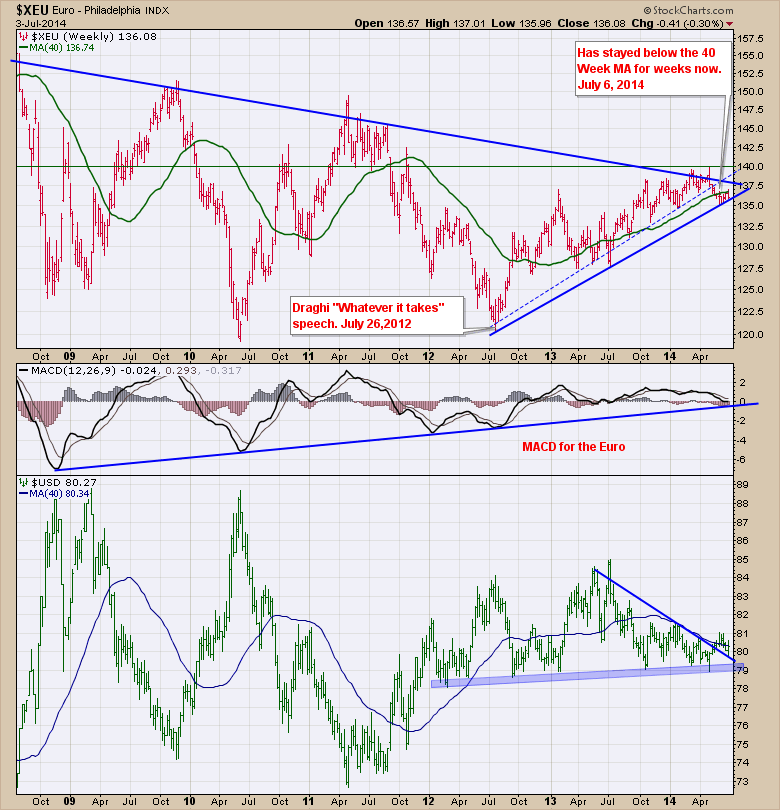
Chart 2 is the Euro Weekly. A few important things to note, the green line is the 40 Week Moving Average (40 WMA). We have been trapped below it for 6 weeks now. I have drawn a dotted line which has a lot more tests of support. It appears to be clearly broken at this point. The push down in 2013 was the only major pullback in the US equity markets. The low on the $SPX was made June 24, 2013. The top resistance line is just overhead. We can see the up slope on the MACD is near the support line. On the US Dollar ($USD) chart, we can see the downtrend has been broken, and we have back tested this line for support. It appears to have held at a critical point. We also have massive horizontal support at the blue shaded area near 79.
Finally here is the daily on chart 3 for the zoomed in view. We can see the Euro clearly broke the major support area which I have marked with a dotted line. Now we seem stuck under the 200 DMA and based on the price action of this week, the backtest of the 200 DMA looks to have failed. We are approaching a major test of the last trend line for support. Just below is the red zone. Usually a good place to go short is on a failed backtest of the 200 DMA.
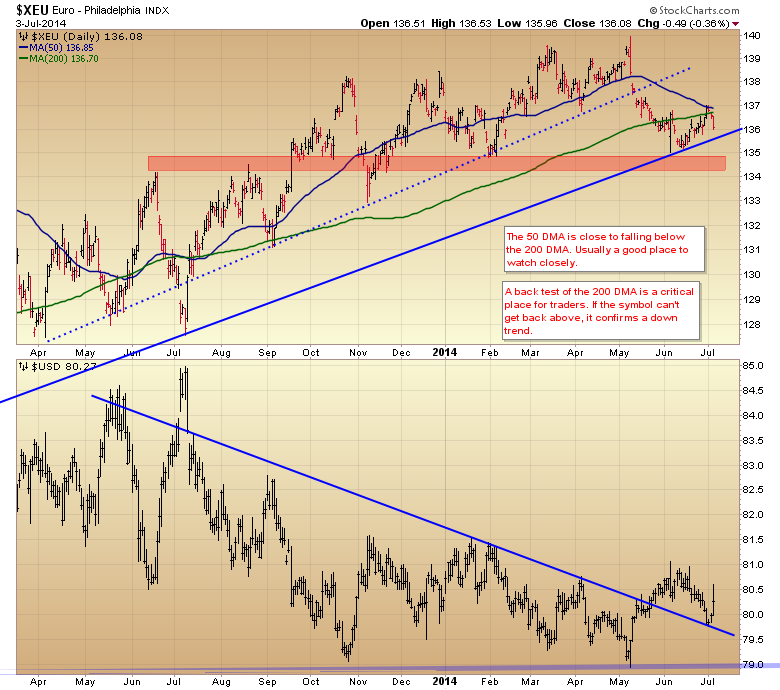
On the US Dollar chart, we can see the back test and bounce that we saw on Thursday. The blue trend line fits nicely on the Feb , Mar, April tops and when extended back it is at the island top gaps. While it doesn't fit nicely on May 2013 tops, it is a good fit of the data we currently have since then.
Should the $USD start a major rally here, all my commodity bullishness may have to wait. The weeks ahead will be important reversal or confirmation weeks as these levels are still close and could revert back into the previous trend. Based on the monthly charts at the top, when these currencies lose trend line support the move is pretty aggressive and significant for major trends.
Good trading,
Greg Schnell, CMT.


