We've been watching our DecisionPoint indicators very closely over the past week as they have moved into neutral and now oversold territory. All three time frames are technically bearish as the indicators continue to fall without bottoming. Carl had written about a minor selling climax in the DecisionPoint blog about a week ago. Thursday we got a major climaxes on our ultra-short-term and short-term indicators.
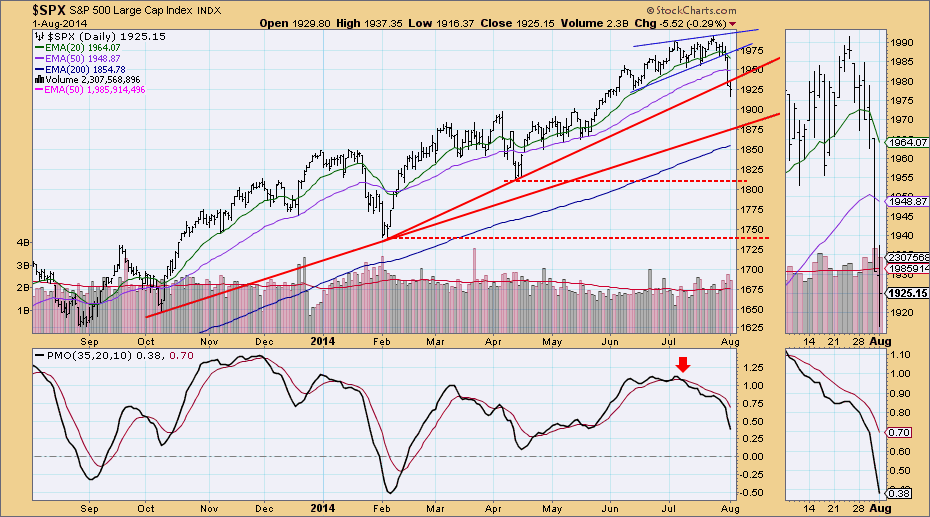
Looking at the chart below from the DecisionPoint Chart Gallery, you can see that Thursday price broke down out of the ultra-short-term bearish rising wedge and then on Friday longer-term support was broken. The next area of support would be at the support line drawn from the October low. That area of support isn't that far away, it would only require price to fall to around 1880. I've annotated possible follow-up support lines at the last two major lows. The PMO has been dropping since the negative crossover that gave us early warning while price was still in the rising wedge.
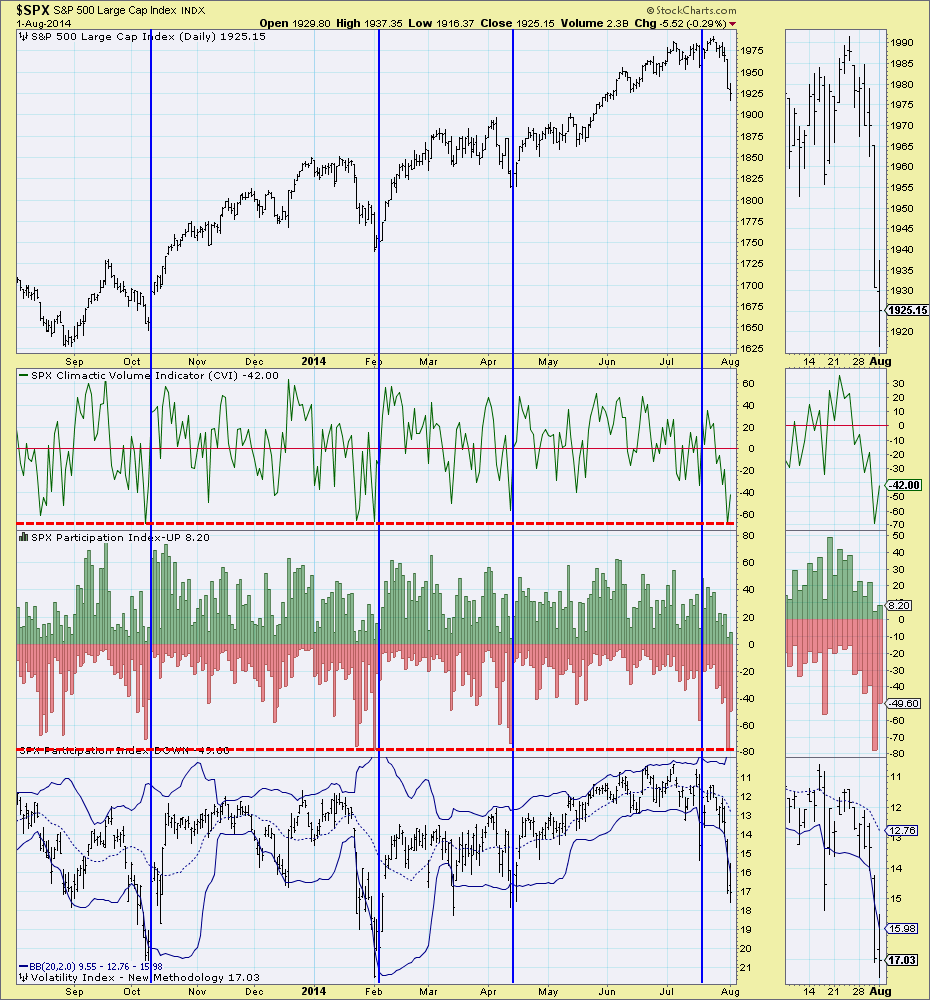
Ultra-short-term indicators all climaxed on Thursday. Climaxes have two meanings. They are either exhaustion climaxes, indicating selling (or buying) pressure has peaked. The other climax, in my opinion, is an initiation climax,. An initiation climax indicates that this is 'only the beginning', expectation is price will continue in the direction that caused the climax. In this case, the initiation would be lower prices. What is interesting is that we saw the follow-through on that climax on Friday when prices continued lower and broke down through support. I think my main issue with this chart is the VIX. When it breaks down from the Bollinger Bands and ultra-short-term indicators have climaxed, a bounce or subsequent rally has ensued.
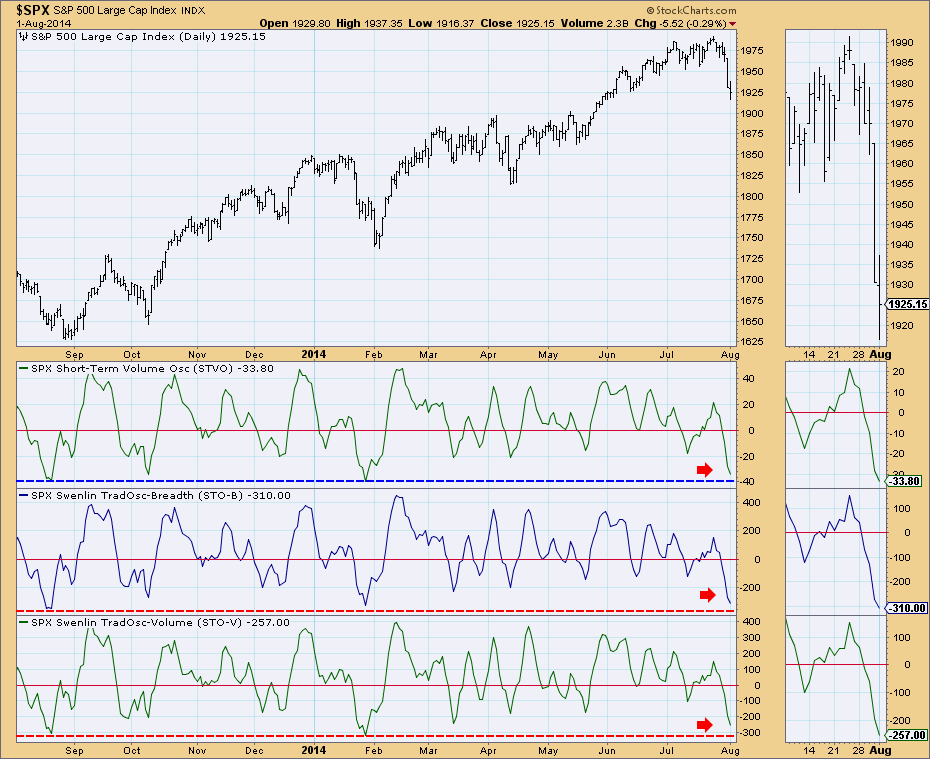
Short-term indicators also had a climax, but it took until Friday. These indicators are still falling despite having hit oversold extremes. While this could represent an initiation climax, I suspect we are going to see a snap back soon that will get these indicators to bottom.
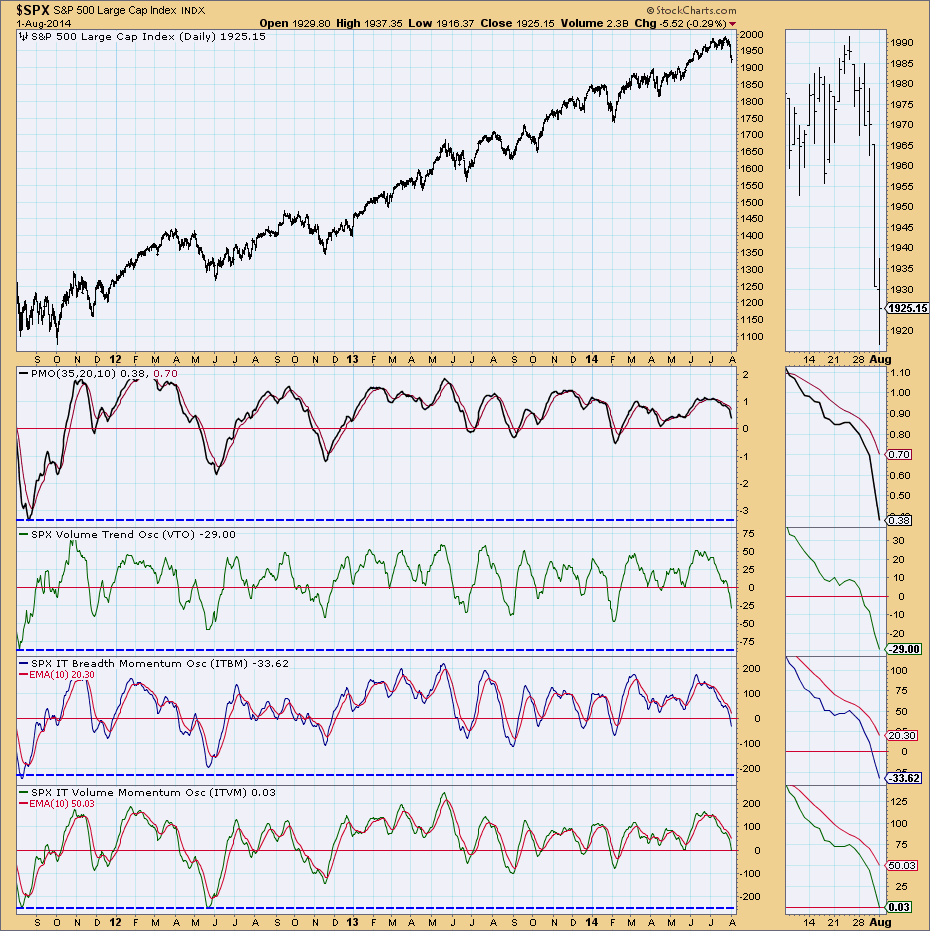
A bounce or snap back would likely be short-lived based on the intermediate-term indicators. Notice that they are falling and have passed through neutral territory, but have plenty of room to continue lower before reaching extremes.
The DP Chart Gallery offers not only the charts above, but even more indicator charts for review. As a paid member, you can also view the same charts for the Dow, NDX and S&P 100. In conclusion, remember that the intermediate term affects the short term and the short term affects ultra-short term. While short-term indicators appear to have reached oversold extremes which is somewhat bullish, the intermediate-term indicators are still very bearish. A short snap back toward the area of failed support is possible, but intermediate-term are bearish enough that a rally or bounce should be short-lived.


