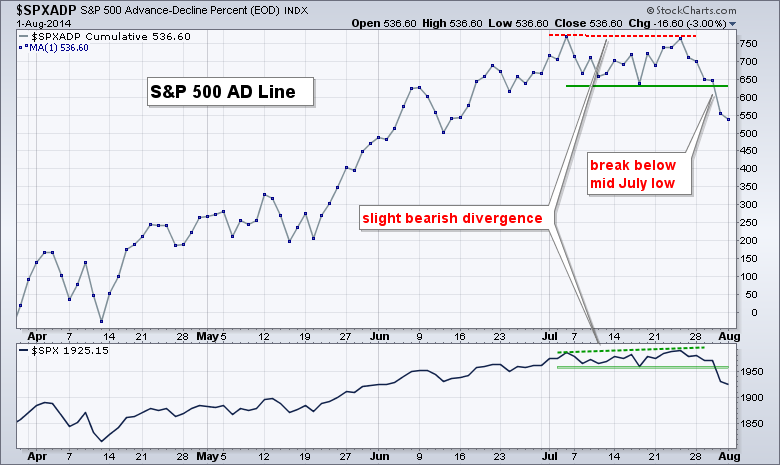
While the S&P 500 and Nasdaq 100 moved to new highs in late July, their respective AD Lines did not follow suit and formed small bearish divergences. The lower highs in the AD Lines indicate that breadth did not keep up with the underlying indices, which suggests narrowing participation.
The first chart shows the S&P 500 AD Line ($SPXADP) forming a slightly lower high last week and breaking below the mid July low with a sharp decline. The indicator window shows the S&P 500 breaking below its July lows as well. This means both the AD Line and the index are in short-term downtrends. The bearish divergence only spans a few weeks and I would not consider it a long-term issue. A bearish divergence that spans two or more months would be more significant.
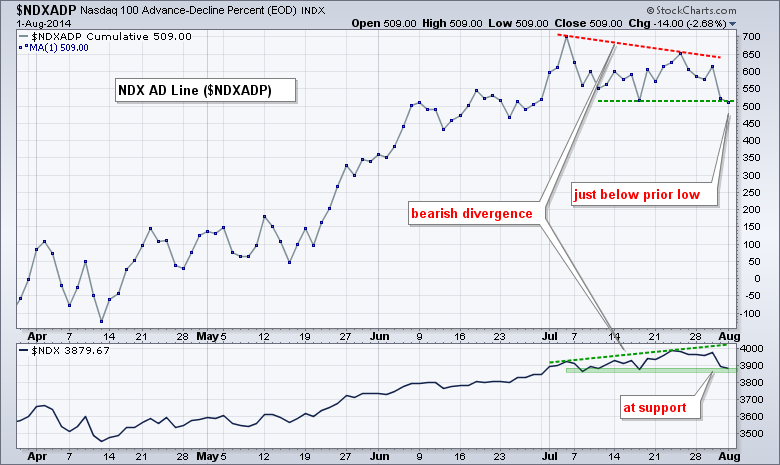
The second chart shows the Nasdaq 100 AD Line ($NDXADP) forming a lower high and moving below the mid July low. Notice that this bearish divergence is a little more pronounced than that of the S&P 500 AD Line because the red trend line is steeper. With a break below the mid July low, the Nasdaq 100 AD Line is in a short-term downtrend and this could foreshadow weakness in the Nasdaq 100 (and QQQ).
Good trading and good weekend!
Arthur Hill CMT


