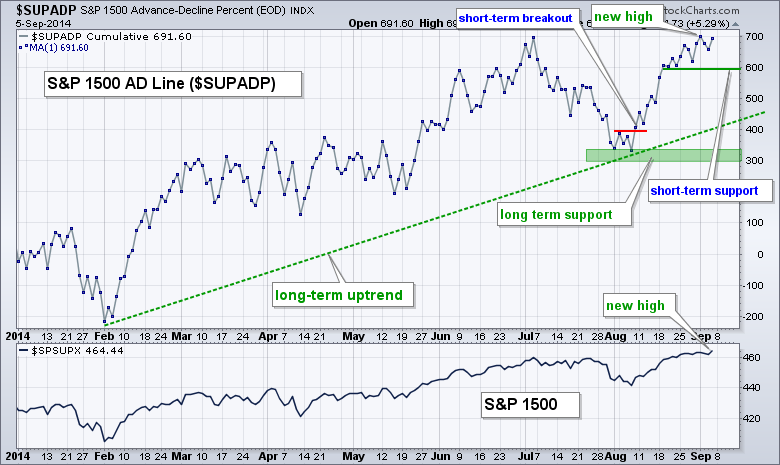
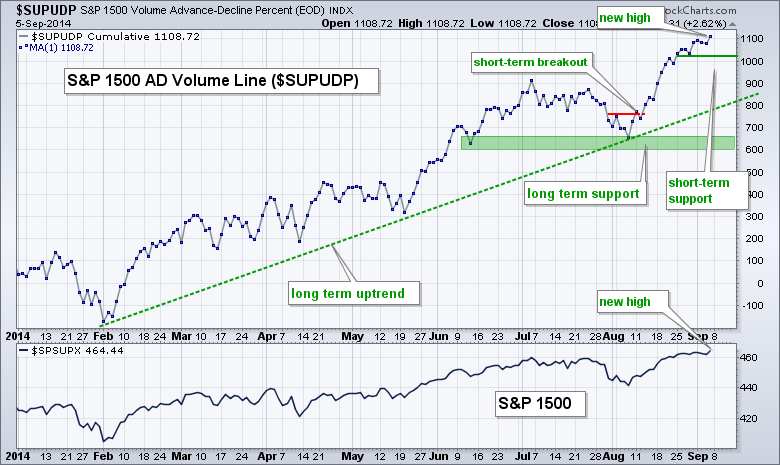
The S&P 1500 AD Line ($SUPADP) and the S&P 1500 AD Volume Line ($SUPUDP) hit new highs to confirm the overall uptrend. This is significant for two reasons. First, a bearish divergence is not possible. A bearish divergence forms when the indicators fail to confirm a new high and turn lower. Second, new highs signal broad internal strength within the S&P 1500. Keep in mind that the S&P 1500 consists of the S&P Small-Cap 600, S&P MidCap 400 and S&P 500. This makes the S&P 1500 a very broad and balanced index that represents the "stock market". Even though the S&P Small-Cap 600 is lagging, the S&P MidCap 400 and S&P 500 are pulling enough weight to keep these indicators strong. In short, the breadth cup is half full, not half empty.
The first chart shows the AD Line forming a higher low in early August and edging above its early July high on Monday. This new high confirms the new high in the S&P 1500 and breadth shows broad internal strength. In other words, majority of stocks are participating in this advance.
The second chart shows the AD Volume Line also hitting a new high to affirm the long-term uptrend. In fact, notice that this uptrend is steeper and the indicator hit a new high well before the AD Line. The AD Volume Line is like a money flow indicator because it is a cumulative measure of net advancing volume (advancing volume less declining volume). Also note that large-caps have higher volume than small and mid caps, and this makes the AD Volume Line a large-cap indicator.
Good trading and good weekend!
Arthur Hill CMT


