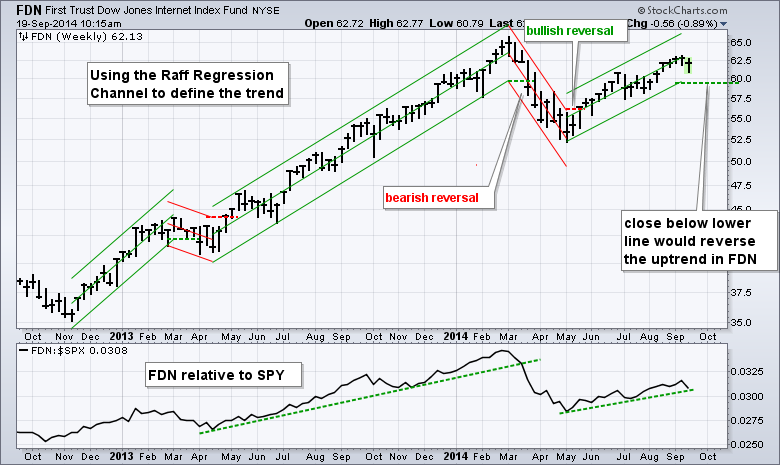
Today's article will show how the use the Raff Regression Channel to define the trend and identify reversals using the Internet ETF (FDN). I am particularly interested in FDN because internet stocks represent the appetite for risk. An uptrend in FDN signals a strong appetite for risk and this is positive for the technology sector. A downtrend in FDN signals a weak appetite for risk and this is negative for the technology sector.
The middle line of the Raff Regression Channel is a linear regression, which is the line of best fit for closing prices. The outer lines are set equidistant from the furthest high or low. The first step to using the Raff Regression Channel is to identify the beginning and ending of a move. An advance begins with the closing low and ends with the highest closing high. A subsequent higher closing price would warrant an upward extension of the channel. A decline begins with the closing high and extends to the lowest closing low. A subsequent lower closing price would warrant a downward extension of channel.
The chart above shows the Raff Regression Channel extending up from the May closing low to the September closing high, which was last week. Should the ETF close above this high in the coming weeks, I would extend the Raff Regression Channel further. I am most interested in the lower line because a close below this line would signal a trend reversal. The channel is rising for the moment and this means FDN is in an uptrend. Hence, the appetite for risk is strong and this is positive for the technology sector.
Good trading and good weekend!
Arthur Hill CMT


