Hello Fellow ChartWatchers!
Friday's rally changed last week's Dow candlestick from a big filled candle into more of a big Hammer (although not a perfect one). After Friday's rally, the Dow finished the week down 1% as did the S&P 500 Large Caps. The big winner for the week was the Russell 2000 which was up over 2.75%(!). For more on this and the longer-term meaning of these moves, check out what John, Art, Greg, Carl and Tom have to say below.
I'm going to spend some time today answering the two most common questions people ask us during our very successful weekly webinars.
Answering Our Top Two Questions
Q1: How do I put two different ticker symbols on the same chart?
A1: Members can add up to 5 additional ticker symbols to a single SharpChart by using the "Price" indicator. (Non-member can add up to three.) Like its name implies, the "Price" indicator displays the price data for whatever ticker symbol you give it. You add the Price indicator using the dropdowns in the "Indicators" area underneath your chart. These are the same dropdowns that contain other technical indicators like MACD and RSI. Just open up one of the free dropdowns and select "Price". Next, change the Parameter box so that instead of "$SPX", it contains the ticker symbol that you want to chart. Finally press the "Update" button to see the new version of your chart. Here's an example:
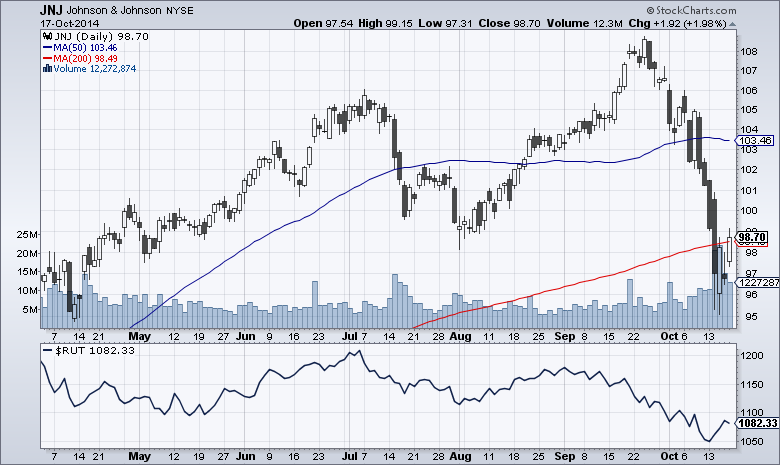
(Click on the chart to see its settings.)
Pitfalls:
There are a couple of things to be aware of when using the Price indicator:
- In addition to the "Price" Indicator that I'm talking about in this article, there is also a "Price (same scale)" Overlay. Make sure you don't confuse the two. In general, you'll want to use the "Price" Indicator for plotting additional stocks or unrelated indexes. The only time you'd use the "Price (same scale)" overlay is when you are plotting several related market indexes that have the same range of values (our Bullish Percent indexes for example).
- You can also choose to overlay one symbol on top of the chart's main price bars by adding a "Price" indicator with the "Position" dropdown set to "Behind Price." However, if you do that, it is important to remember that the two symbols are plotted on different vertical scales. That means that crossing signals are not valid on those kind of charts - but trend divergence signals are.
Q2: What are SCTRs and how can I use them?
A2: SCTRs (pronounced "Scooters") are short for "StockCharts Technical Rank." They are a relative strength ranking based on technical analysis techniques recommended by John Murphy. (For the precise formula, click here to read our ChartSchool article on SCTRs.) Whenever the markets are open, we are constantly re-ranking all the stocks we track and assigning them a number between 0 and 100 based on their relative technical strength.
You can see a stock's SCTR value in a couple of different ways. Probably the easiest way is by checking the "Full Quote" checkbox for your chart and then clicking "Update." The SCTR value will appear inside the Full Quote area at the top of your chart. The other way to add SCTR values to your chart is to add the "SCTR Line" Indicator to your chart. It is located in the same "Indicators" dropdown that I mentioned above - the ones with the MACD and RSI indicators (in additional to lots of others).
When you add the "SCTR Line" Indicator to your chart, not only do you see the current SCTR value for your chart's main ticker symbol, but you also see how that SCTR value has changed over time. Has the SCTR been increasing over time? Decreasing? Oscillating? The SCTR Line indicator can show you those answers at a glance. Here's an example:
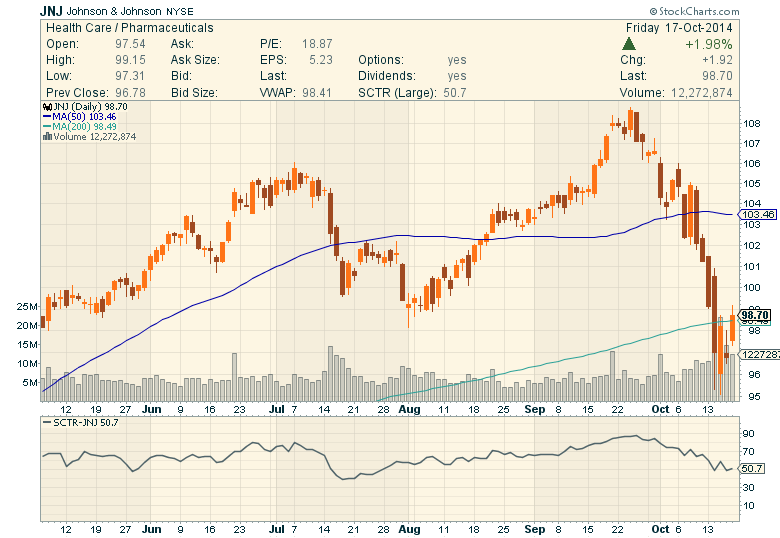
(Click on the chart to see its settings.)
For more on SCTRs, be sure to review this article and this video.
OK, hopefully that has helped everyone with those two popular questions. Be sure to join Greg for our next webinar which will be held next Friday (click here to register early, click here to view last week's episode, and click here to ensure you computer works with the webinar software ahead of time).
Take care,
- Chip


