Fair warning! If you read this article and get hooked on cycle analysis, you will rue the day. If we look at price charts, we can clearly see that prices move up and down in cycles, but trying to use this tool can be frustrating beyond words. There are certainly others who are better at it than I, but I have kept an eye on cycles throughout the years. In the last few years I have pretty much ignored cycles, because they have more or less disappeared under the mountain of money printed by the Fed, but I noticed that they seem to have reappeared since the February price low. So, while I have been resisting the idea of writing this article, StockCharts has some very cool cycle annotation tools (darn it!), and I just couldn't resist doodling with them.
To begin, let me say that these are my personal views regarding cycles, and others will have different ideas about them. My work with nominal cycles involves the 5-Week, 10-Week, 20-Week, and 40-Week (aka 9-Month) cycles, which seem to move under the market like ocean tides. They are not tied to any fundamental events, in fact such events often disrupt the normal ebb and flow of cycle movement. The shorter cycles are subordinate to the longer cycles, meaning that a shorter cycle is considered to have bottomed at the same time the longer cycle bottoms. Nominal cycles are measured from trough to trough.
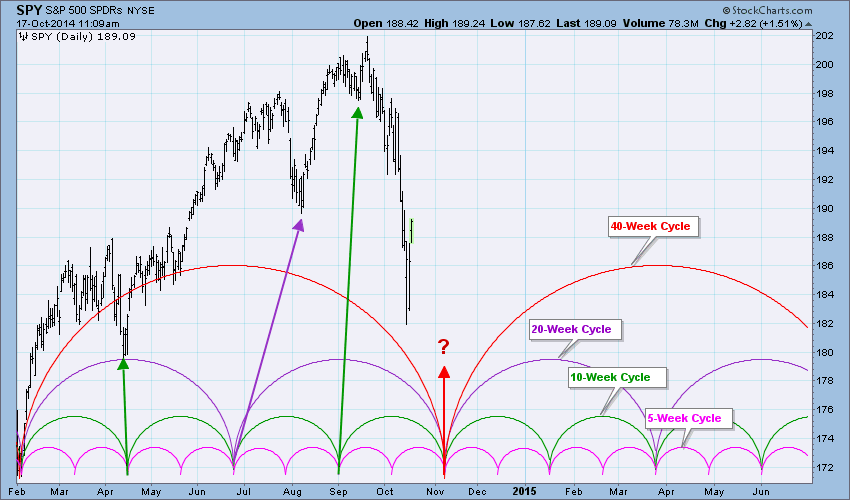
What prompted me to write this article was the chart of current market action and its apparent fit into a cycle template. The dominant feature on the chart is the projected 40-Week Cycle trough (and nesting of all subordinate cycles) in early November. We will look at this more closely a little later, but first let me explain a few other things.
From an intermediate-term perspective the 40-Week and 20-Week Cycles are the most important, and they are of almost equal importance. There are, obviously, two 20-Week Cycles within the 40-Week Cycle, and most of the time the first 20-Week Cycle will run longer than the second one. On the chart above we see that a 20-Week trough was due in June, but it didn't manifest itself in price movement until August, about six weeks late. The current 20-Week Cycle will be compressed when the 40-Week Cycle makes a trough, currently projected for November 6. But we are reminded that cycle analysis often works best in hindsight.
The big question at this point is if the projected November 6 trough will arrive on time, because the cycle could arrive early or late by a month or so. This is where the aggravation begins. An argument could be made that it actually arrived early with this week's price lows. I am inclined to think that there will be a technical bounce (already started) out of those lows followed by another decline to retest those lows. This process could take several weeks, putting the retest low right around the first part of November. The retest low could be higher than recent lows, but I would still consider it to represent cycle completion if it arrives near the projected date.
Finally, we look at the price arc and note that the 40-Week Cycle price high is located to the right of center. This is called a "right translation" and it is bullish.
Conclusion: This has been a very brief overview of nominal cycles with a focus on the current 40-Week Cycle. The idea that an important low may be made after the bounce out of this week's lows is by itself sound on a technical basis. Framing it within the cycle template makes it more compelling. The right translation implies that the market may not be finished making new highs. But before we rely too heavily on a projected cycle low that is very close to Halloween, remember that Bela Lugosi would say, "Bevare!"
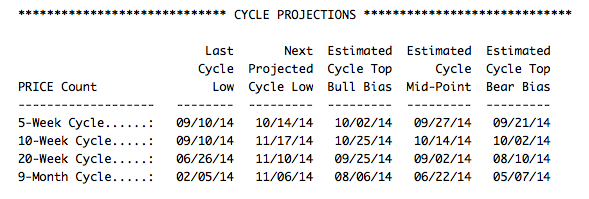
Note: In our DP Alert Daily Report we publish a nominal cycle projection table. Sample below: