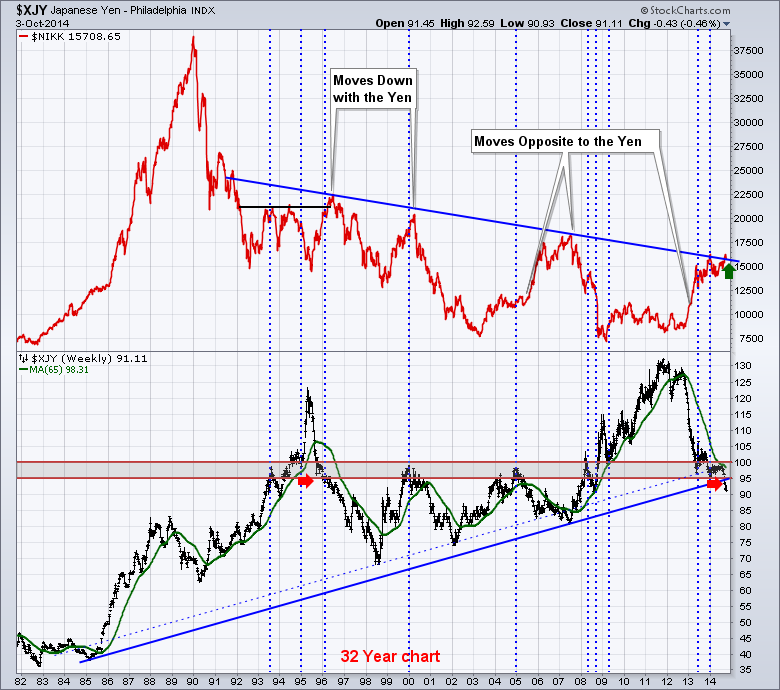
I have been very interested to watch the Japanese Equity Market ($NIKK) to see if it can hold the breakout from the 25 year trend line. First of all, here is a long chart.
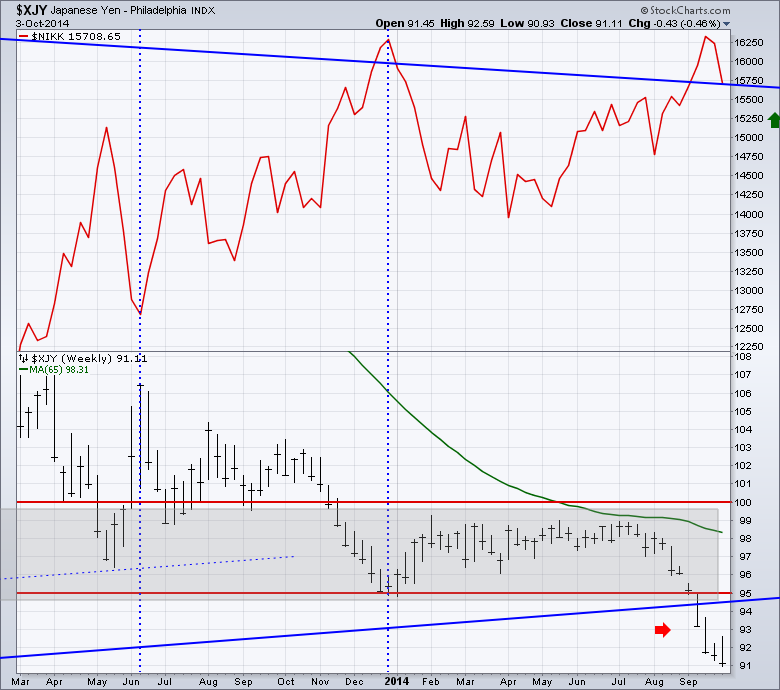
Why does this matter? When a long trend line breaks it is usually very important. Lets zoom in on the last year:
If this breakout fails, it usually will be a meaningful plunge down instead. We can see it closed back at the trend line on Friday. If the $NIKK can break out it will be powerful. The fact that the Yen closed near the lows but was an outside day is interesting. If the Yen started to rally against the $USD, we would probably see the $NIKK pull back. Time to watch closely as the volatility is picking up on the $NIKK with a big 400 point down day this week. This trade could be traded through any of the Japanese ETF's and preferably the hedged ETF's so the currency exchange does not wipe out your profit.
Thursday's Webinar -
I had a great time last Thursday during our 4:30pm Webinar. We had some great questions from the audience. If you weren't able to make it (and you have the bandwidth), you can click here to see a replay.
Good trading,
Greg Schnell, CMT


