Make no mistake about it, volume has exploded and stock prices have fallen and lost key support levels. That combination is bearish in and of itself. But the part that really bothers me is that intermarket warning signs have been flashing for months so this high volume market drop confirms that we're likely in for more weakness before the stock market improves.
One warning sign that I began discussing several months ago was the relative weakness in small cap stocks. The Russell 2000 topped in early March and did not follow the other major indices to fresh new highs over the summer. Yet on CNBC and elsewhere, all the talk centered around all-time highs on the S&P 500 and how the U.S. economy was gaining strength. It was certainly true, but rarely did media outlets caution individual investors about where the money was rotating to on a relative basis. And, as far as I'm concerned, the charts speak much louder than words on CNBC. If the U.S. economy was truly stronger than in other parts of the world and gaining strength, then why wouldn't the Russell 2000 be leading the action to the upside? This index is comprised of companies who sell almost exclusively to customers in the U.S.!
The potential for domestic economic slowdown and a possible recession increases when small caps lag on a relative basis. Check out this chart:
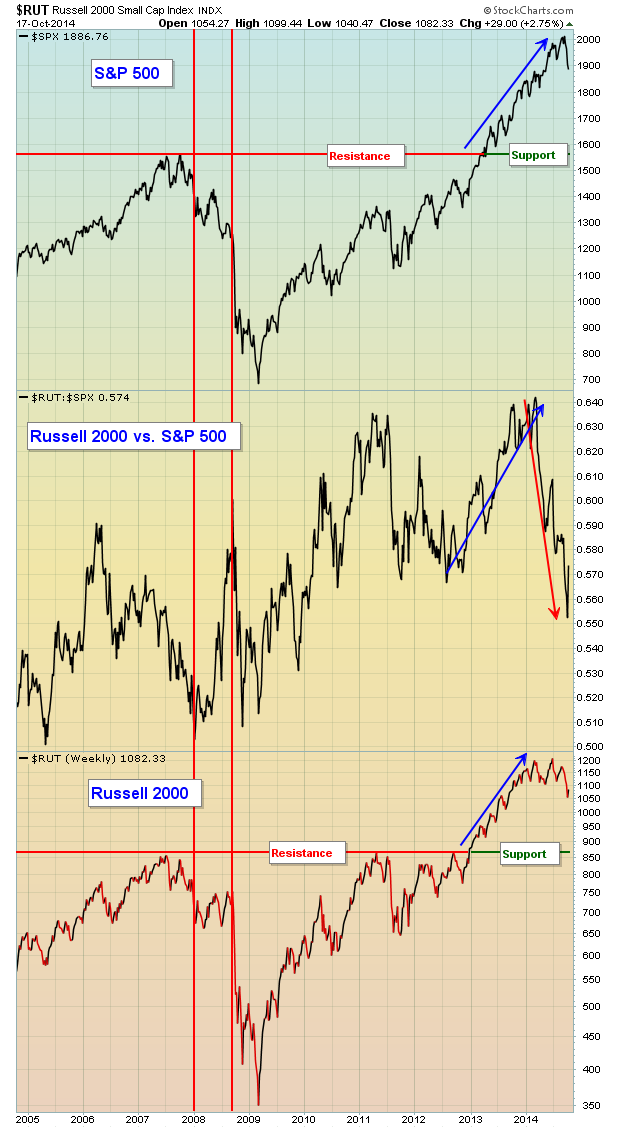
I want to make a few points about this chart. First note that, for the most part, when the S&P 500 and Russell 2000 rises, the relative strength of small caps ($RUT:$SPX - middle chart) tends to rise as well. This tells us that the more aggressive small cap index is leading the benchmark S&P 500 to the upside. That's very good news and generally leads to bull market sustainability because it's signaling that investors remain aggressive. But check out the relative downtrend in the $RUT:$SPX in 2006 and 2007, just before the stock market top in October 2007. Money was rotating away from small caps and that was a warning sign. Fast forward to 2013. Note that as both the S&P 500 and Russell 2000 were moving higher, the relative performance of small caps was EXCELLENT. That completely changed in 2014. Money has been rotating away from the Russell 2000 ahead of the recent stock market downturn. This was just one of the several warning signs that, in my opinion, has led to the recent market rout. There was one false signal given, which is highlighted by the two red vertical lines. During that period in 2008, small caps outperformed which could have been misconstrued as a bullish sign. The primary reason for this incorrect signal was due to the sudden collapse of financial stocks which carried the S&P 500 down much faster than its small cap counterpart. Still, it's obvious to me that following the relative performance of these two indices vs. one another provides us valuable clues as to future market direction and the possibility of a major shift in how big money views the stock market.
Let's discuss one more warning sign - the relationship between consumer discretionary, or cyclical, stocks (XLY) and consumer staples stocks (XLP). When our economy is expected to grow, discretionary stocks outperform their staples counterparts as consumers feel good about spending money on "discretionary" items. When a slowing economic period approaches, money will begin to rotate to the safer consumer staples stocks as hopefully everyone will continue to buy toothpaste and soap no matter the economic conditions. Following a simple ratio of XLY:XLP can yield some rather dramatic clues about the likelihood of a sustained market advance. Take a look at this chart:
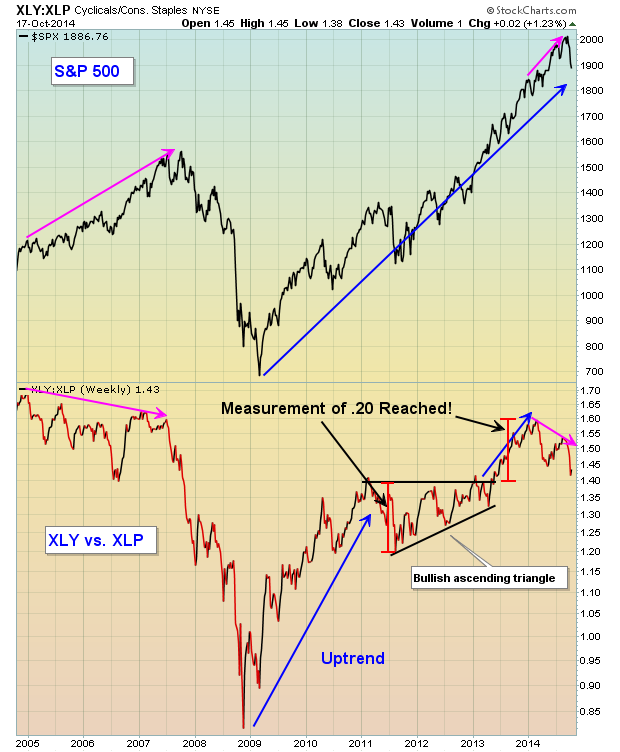
It's easy from this chart to see that money was rotating away from discretionary stocks in 2006 and 2007 AHEAD of the 2007-2009 bear market. In 2013, the ratio between consumer discretionary and staples stocks was awesome as investors continued pouring money into discretionary stocks on a relative basis and the bull market was sustained. In 2014, that relationship completely reversed course, however, as market participants "prepared" for upcoming market weakness by rotating towards more defensive areas like consumer staples.
On Thursday, October 23rd, I will be hosting a FREE webinar to discuss the above warning signs, in addition to several more. Also, I'll discuss what I'll be looking for to determine if and when the bull market will resume. CLICK HERE for more details. Hope to see you there!
Happy trading!
Tom Bowley
Chief Market Strategist
Invested Central


