I wrote a blog article some time back that questioned whether the Gold Miners stocks had finally hit rock bottom. I concluded that it was a good set-up for a bottom but there was still plenty of room for decline before they hit all-time lows. The stocks in the Gold Mining Industry Index, $DJUSPM may have hit their bottom, but our indicators in three time frames warn us of trying to catch a falling knife.
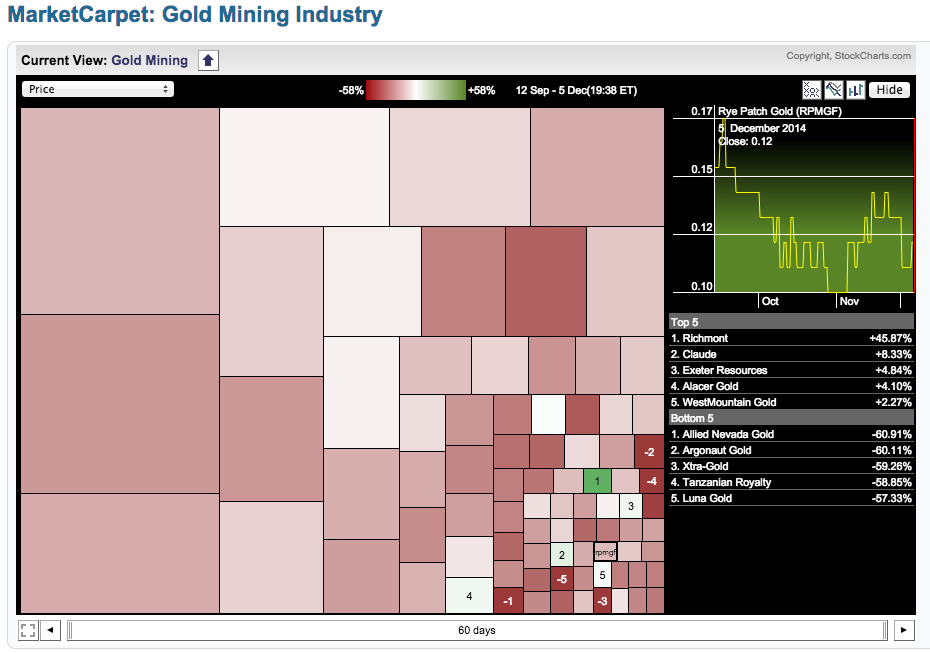
The Market Carpet for the Gold Mining Industry shows just how devastating the last 60 days have been.
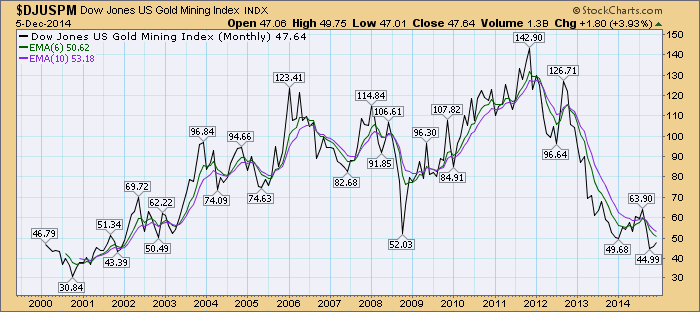
Let's start with the long-term view and move out from there. Since this index began, the all-time low was 30.84, price is not there yet but it is getting very close. This year both the 2003 and 2008 lows were taken out. The question is whether the all-time low will be taken out soon.
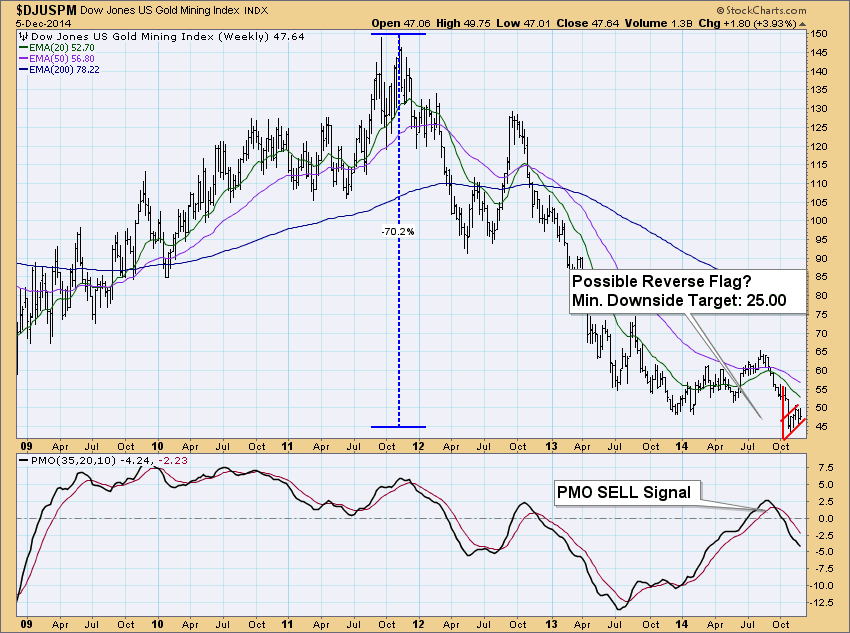
On the weekly chart this sector has taken more than a 70% beating! Unfortunately when we look more closely at this chart, there is a possible bearish reverse flag in play. If this flag were to execute downward, the decline would be the length of the flagpole. The minimum downside target would be 25.00. The Price Momentum Oscillator (PMO) in the third quarter of this year and has been declining ever since. Worse is that it is only in neutral territory and has much further to fall before reaching oversold levels.
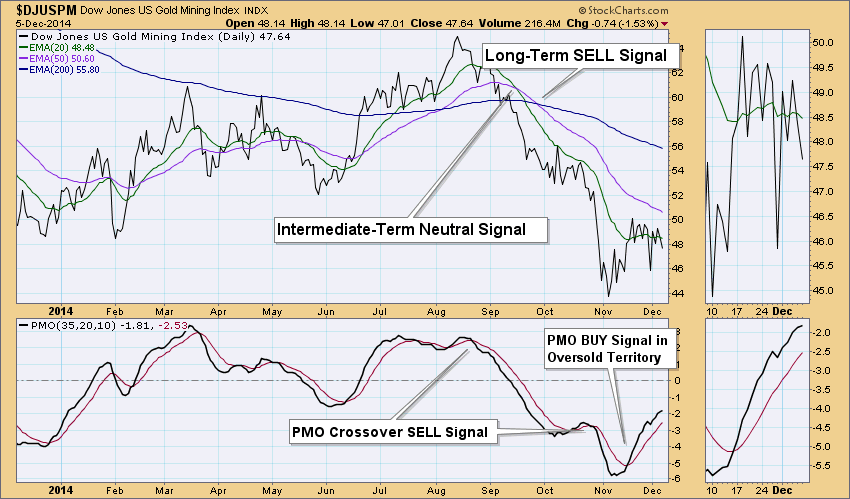
In the shorter-term daily chart, the picture doesn't get much more optimistic. There's a lot going on here. The PMO is rising after a positive crossover in oversold territory which is bullish, but notice that it is beginning to decelerate. A PMO top below the zero line would be very bearish. Notice right before the big correction a PMO SELL signal was generated in August, followed by the 20-EMA crossing below the 50-EMA. That generated a Neutral signal on the DP Intermediate-Term Trend Model. Why not a SELL signal? Because the 50-EMA was still above the 200-EMA at the time which implies this sector was in a bull market. However, shortly thereafter the 50-EMA crossed below the 200-EMA which generated a DP Long-Term SELL signal. The Neutral signal doesn't change; once the Trend Model generates an intermediate-term Neutral (or SELL) signal, it doesn't change until it gets a positive 20/50-EMA crossover and generates a BUY signal. To read more about the DP Trend Model, check out the article in ChartSchool.
It is hard to imagine the index reaching 25.00, but with the reverse flag shaping up and its potential execution, it is entirely possible. However, if it doesn't execute, then a bottom might well have been reached or at a minimum, the prospective downside target could be avoided.
