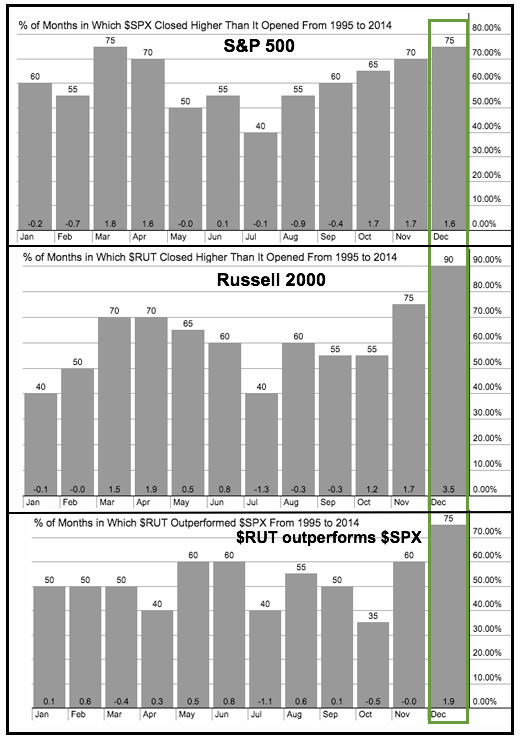
There are two bullish seasonal patterns at work right now. First, stocks have shown a strong tendency to advance in December. Second, small-caps have shown a strong tendency to outperform large-caps in December. Over the last twenty years, the S&P 500 has risen 75% of the time and the average gain was 1.60%. The Russell 2000 has risen 90% of the time and the average gain was 3.5%. Yes, you read right. Don't take my word for it, check out our seasonality charts below. This is a pretty staggering statistic that gives the Russell 2000 a bullish bias heading into yearend. Furthermore, Charlie Bilello of Pension Partners took December seasonality one step further and found that most of the strength comes in the second half of the month. And finally, it is also worth mentioning that the Russell 2000 outperformed the S&P 500 75% of the time over the last twenty years. Seasonal tendencies are one thing, and trend is another so I will focus on the IWM chart after the jump.
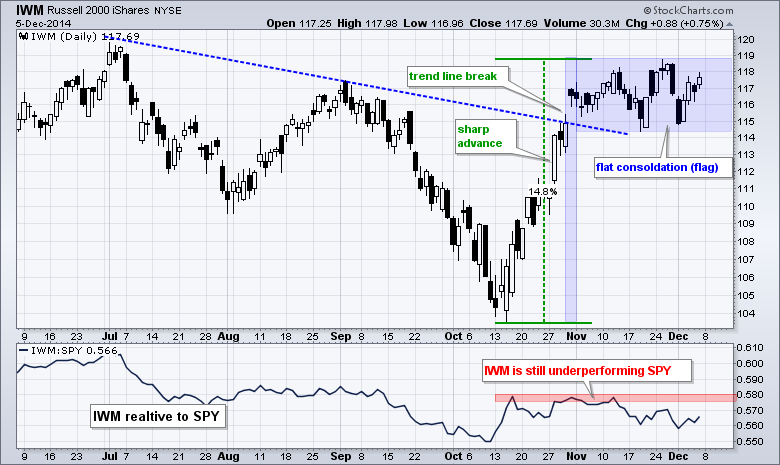
The Russell 2000 iShares (IWM) has yet to start out performing and is up less than 1% so far this month. The second chart shows IWM surging in October and then consolidating the last five weeks. Even though it is not picture perfect, the pattern resembles a flat flag, which is a bullish continuation pattern. IWM bounced off support in the 114-115 area twice, but remains shy of a breakout that would signal a continuation of the October surge. A break above the November highs would confirm the bull flag and target a move to new highs. The indicator window shows the IWM:SPY ratio working its way lower the last few weeks. The ratio has yet to break the mid October low, but IWM shows relative weakness and a break above the October-November highs is needed for IWM to start showing relative strength again.
Thanks for tuning in and have a great weekend!
Arthur Hill CMT


