Technicians are a serious bunch. When we get a trend line break to the upside or downside, it is very critical for us. It is our trigger. However, the way the data is displayed is very important as well.
Here is a chart of 4 related subjects on a performance chart which shows the movement in % terms. They rise and fall together over time but the percentage change is different. A one-to-one fit? No. The components are the Emerging Markets ETF (EEM), the Emerging Markets Currency ETF (CEW), Brent Crude Oil ($BRENT) and the Hang Seng Index for Hong Kong ($HSI). They have reasons to be correlated. Crude Oil is one of the world's largest commodities and is used in every country. The Currency ETF of Emerging Markets is highly correlated to commodities. When commodities are doing well, so do emerging markets. Hong Kong is one of the largest business centres in the developing world.
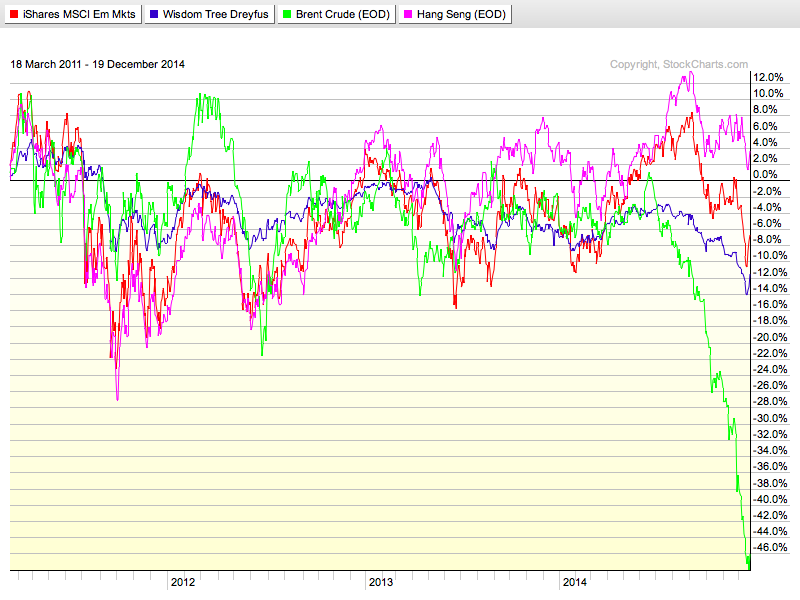
So the recent plunge in crude oil has also been showing up in the other 3 charts, but not to the same extent.
Let's stack the graphs and show the information based on actual price.
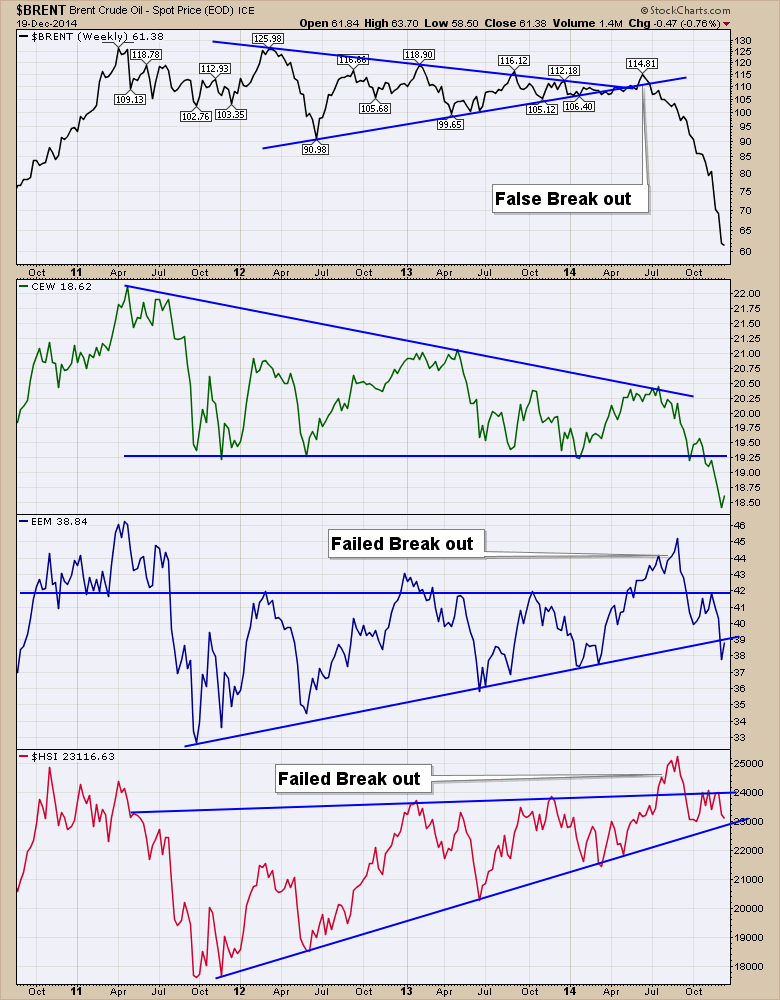
I left the annotation lines on the charts, but I changed the chart style to High-Low-Close bars.
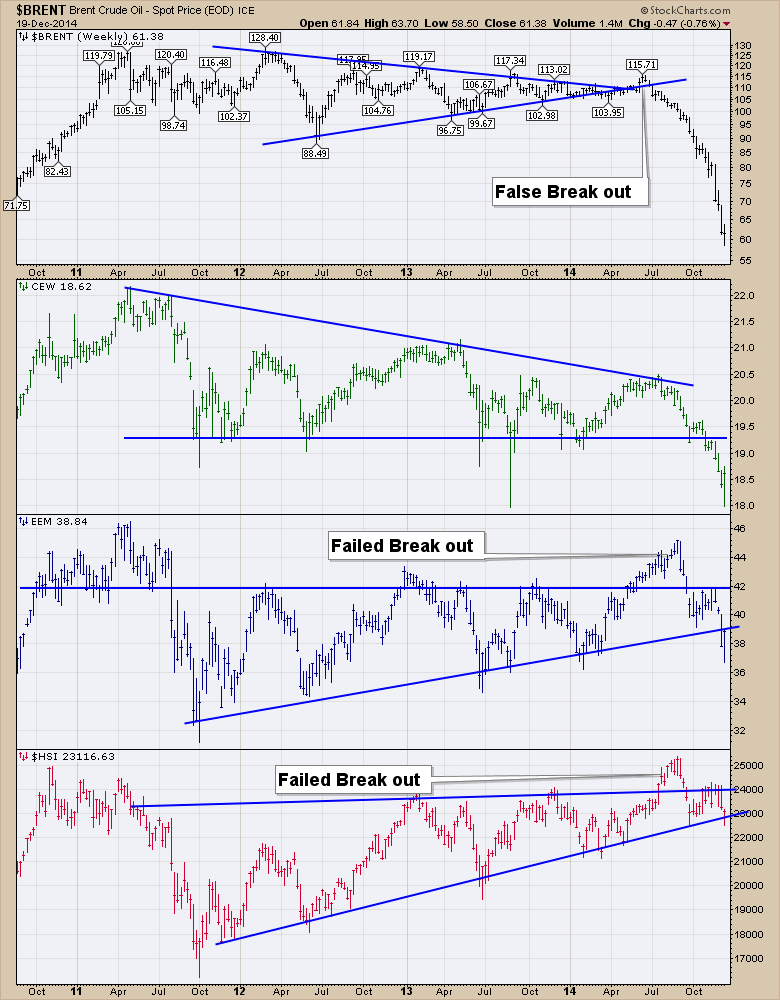
So we have two completely different charts to wrap up this week. On Brent Crude Oil ($BRENT), we have a stall in downward price momentum with it closing flat on the week after testing higher and lower. The line chart didn't display that very well. The Emerging Market Currencies (CEW) bounced off intra week support and closed higher, but the line chart looks a lot more ominous by showing no signs of an intra week support test. On the Emerging markets ETF (EEM) HLC chart, the size of the move below the trend line seems to be demonstrating that this is significant. We have a higher close that is back-testing the trend line on the HLC chart and we clearly show 2 weekly closes below the line on the HLC chart. The same is true on the EEM 'line' chart, but might not be thought about as 2 weekly closes below the trend. Definitely one to watch. The last is the Hang Seng ($HSI). With the inter market relationships between these components, it was very concerning to see the $HSI plunge below support mid week on the HLC chart (and line chart at the time). By Friday, two dramatic back to back up days has everything looking ok with support holding. The line chart shows no damage on Friday's close! I mentioned in the last 2 weekly webinars that a break in the Hang Seng chart right now would pretty much confirm a global slowdown.
The bottom line is there is significant reason to be jumping in going long here at support, or jumping out expecting the inter market correlations to continue to break in a downward trend. If Crude Oil ($BRENT) has in fact found a bottom this week, it couldn't be a better time to get optimistic on all of these charts. If crude doesn't bounce but stagnates down here like it did at $88 and then rolls lower, will these charts all break down over the next month? Quite frankly the 2 day rally in equities was the largest in 6 years on what I would consider to be weak news that the Fed doesn't see the markets performing well enough to raise rates right away. Is a 5% market pullback all it takes to change the Fed's direction? It doesn't matter what I think. We'll watch the markets' response. The trend lines are holding on EEM and $HSI after a tough look intra-week. The next 2-3 weeks are pivotal for those charts.
For a more optimistic view of this week's action, check out this chart. We had a serious 2 day reversal so that should be considered as optimistic. If we look for the bullish information on each chart, this would be the turning point. Check out Brent Crude Oil ($BRENT) bouncing off long term trend line support. The Emerging Market Currencies (CEW) are finding support at a prior low. That's bullish!
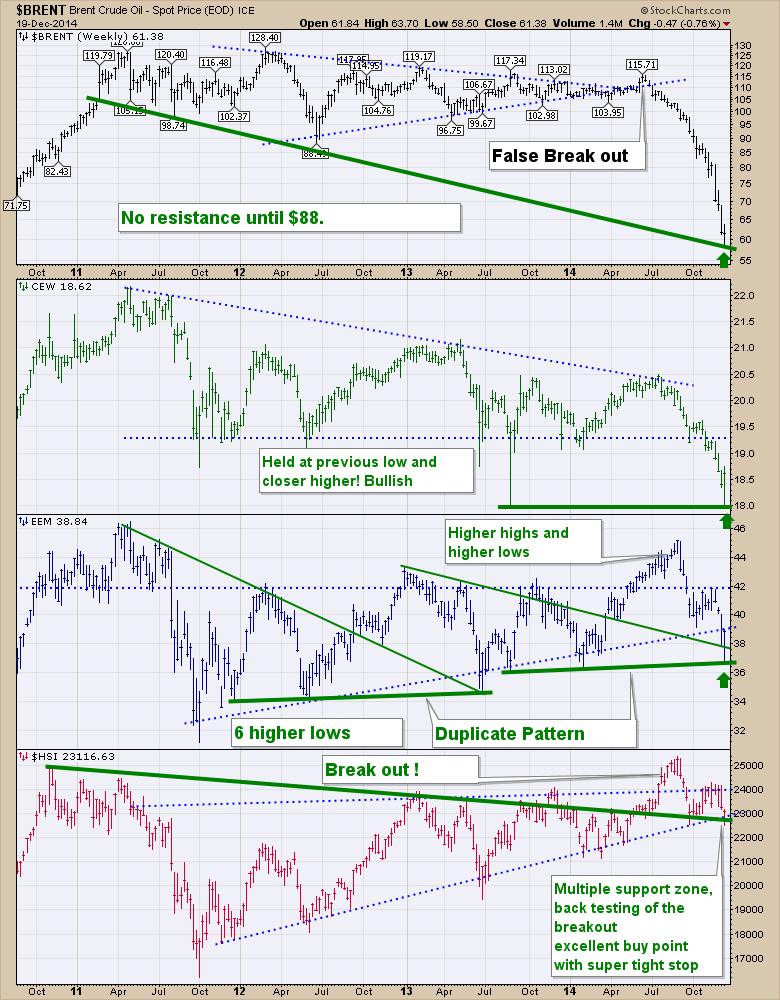
The Emerging Markets ETF (EEM) has 6 higher lows, 2 duplicate patterns and a series of higher highs and higher lows. It is currently in a three wave correction and ready to turn higher again. EEM is currently back-testing a 2 year major down trend line after breaking out. One of the best possible buy points. The Hang Seng ($HSI) is currently back-testing a 4 year trend line. By bouncing here at a multiple support zone (downward and upward trending trend lines), we couldn't be more bullish. We have been making higher lows for 3 years and this is an ascending triangle. The upside measurement is to 31000.
How we interpret the data is critical and we are definitely at a critical time. When I said EEM had 6 higher lows, so did crude before falling 50%. The plunge in crude below not only horizontal support but to a 50% drop leads me to believe they will all end up moving lower. That is my inter-market bias. Remember the stock market breaking down 20% in 2008 and crude ran up another 60% from there to all time highs at $149 saying everything was fine? Now the opposite is true. Crude has fallen 50% and the market is at all time highs. If the markets start to let go, I would not stand in the way of the polar express sending a chilling trend into the market. If the intra day volatility near a market high is at the same levels as a rebound in a collapsing market in 2008, is that a bullish or bearish signal? Increased volatility is usually associated with a market top after a long run up.
The reality is we are testing the bottom of everything on these charts and a market high on the $SPX. If these ticker symbols all break this support zone, its a worrying time for the primary trend. If the trend lines can hold and go higher here, so should our investment decisions. Feels like one of the major chapters in a great novel.
Good trading,
Greg Schnell, CMT


