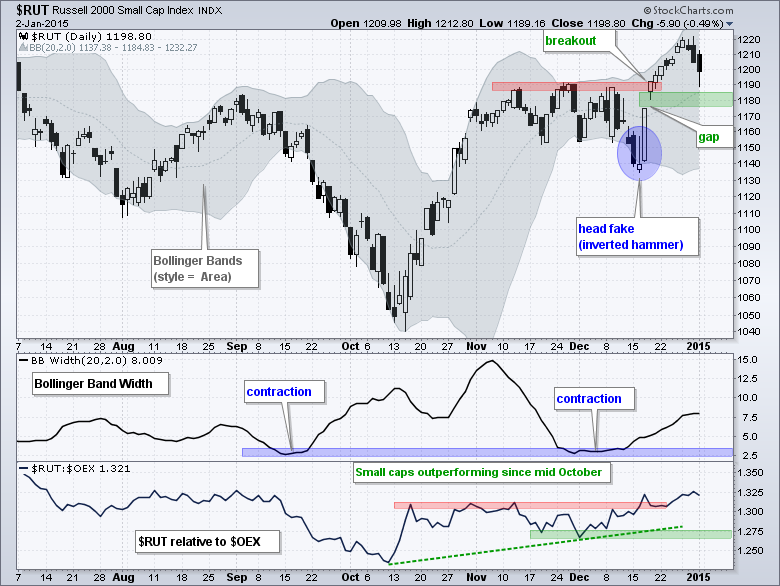
A month ago in ChartWatchers I wrote about the bullish seasonal pattern for small-caps and featured a big flag pattern on the chart for the Russell 2000 ETF. Trading turned volatile in mid December, but the bullish seasonal pattern held up and the Santa Claus rally ultimately materialized. The Russell 2000 gained 2.68% in December and outperformed the S&P LargeCap 100, which lost .86%. So what now? First, let's review the price action in the Russell 2000 over the last few weeks. The index consolidated from early November to early December and the Bollinger Bands narrowed as volatility contracted. Notice how BandWidth was below the 3% threshold in early December. The Russell 2000 appeared to break down in mid December, but formed an inverted hammer on 16-Dec and confirmed this bullish candlestick reversal pattern with a surge and gap the next two days. This head fake is not as uncommon as one might think. In fact, John Bollinger advised chartists to beware the "head fake" in his book, Bollinger on Bollinger Bands.
Thus, with the head fake and subsequent breakout in mid December, the Russell 2000 is on the bullish track and showing relative strength. Chartists should now look for levels that would invalidate the bullish case. My first important level is in the 1180 area. A move below 1175 would put the index back below the breakout and fill the gap. This would negate the breakout and call for a reassessment. The bottom indicator shows the Russell 2000 relative to the S&P 100 ($RUT:$OEX). This ratio has been rising since mid October and recently broke above its October-November highs. This means the Russell 2000 (small-caps) is outperforming the S&P 100 (large-caps). A move below the early December low would signal a return to relative weakness in small-caps.
Thanks for reading and best wishes for 2015!
Arthur Hill CMT


