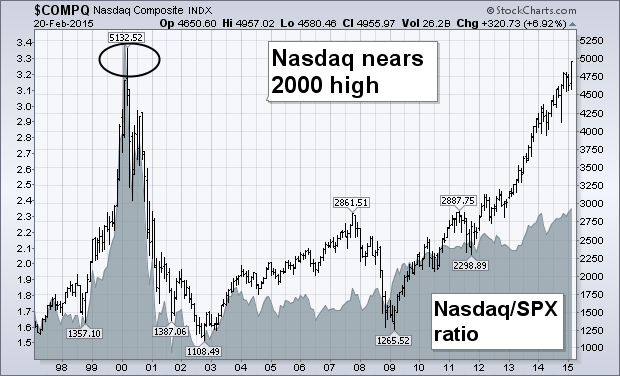
The monthly bars in the chart below shows the Nasdaq Composite ending the week just 177 points (3.5%) from its March 2000 intra-day high at 5132. [It's only 93 points (1.9%) from its 2000 closing high at 5048]. There's little doubt that it will reach that major milestone in short order. The question is what will happen when it gets there. It's not unusual for a major index to encounter some profit-taking when it reaches a major previous peak. But I doubt it will mark a major top. Although it's currently the only U.S. stock index that hasn't hit a record, that doesn't mean that it hasn't done as well as the others. It's actually done much better. It just had more ground to make up. The Nasdaq lost nearly -80% between 2000 and late 2002, while the S&P 500 and Dow lost -40% and -20% respectively. Since the 2002 bottom, the Nasdaq has gained 320% versus an S&P 500 gain of 160% (the Dow rose 140%). Since the spring 2009 bottom, the Nasdaq gained 260% which outpaced an S&P gain of 187% (and the Dow's 156%). That stronger Nasdaq performance can be seen by the rising Nasdaq/SPX ratio (gray area) since the 2002 and 2009 bottoms. The fact that the technology-dominated Nasdaq is leading the market higher argues for continuation of the secular bull market. So does stronger action in foreign markets.
- John


