We've seen a very nice rally in U.S. equities during February, erasing all of January's losses with most of our major indices now breaking out to all-time highs. The NASDAQ has been leading the charge and that indicates that we're in a "risk on" environment, which is bullish for equities. Confirming that bullish environment is the relative performance of consumer discretionary stocks (XLY) vs. consumer staples stocks (XLP). In my last article, I provided a chart of the XLY showing the breakout that occurred in early February. Home construction ($DJUSHB) was a leader during that breakout and the rally in discretionary stocks has continued the past two weeks. More importantly, the ratio of the XLY:XLP has been on the rise. This tells us that traders are much more interested in the discretionary side (aggressive side) of consumer stocks. That could change in the near-term, but before I explain further, take a longer-term look at how this ratio has performed:
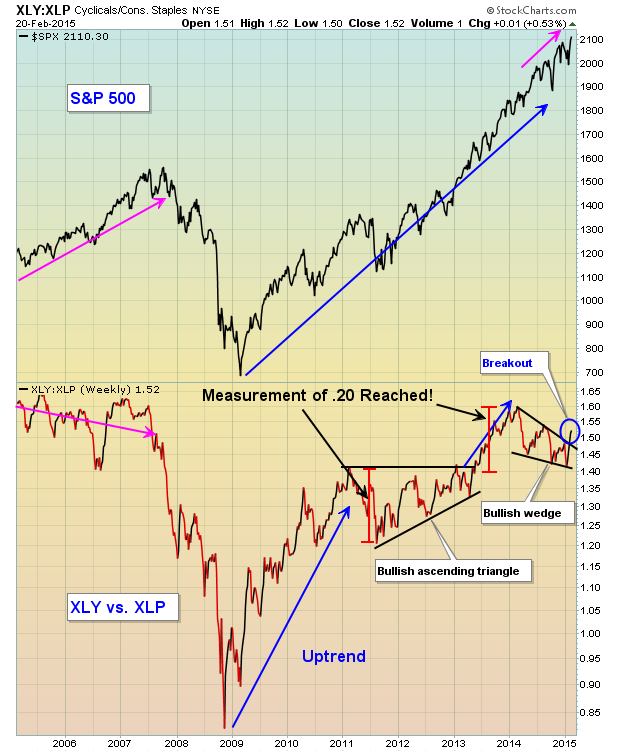
Over the last year, the XLY:XLP ratio has been trending lower, which generally I'd consider to be a bearish development. But relative charts can consolidate in continuation patterns just as individual stocks and indices do. You can see the ascending triangle that printed during 2011 and 2012, just prior to consumer discretionary stocks exploding higher in 2013. The past year appears to have set up a bullish wedge, the breakout of which is likely to lead to a strong discretionary sector throughout 2015 - at least based on current technical signs.
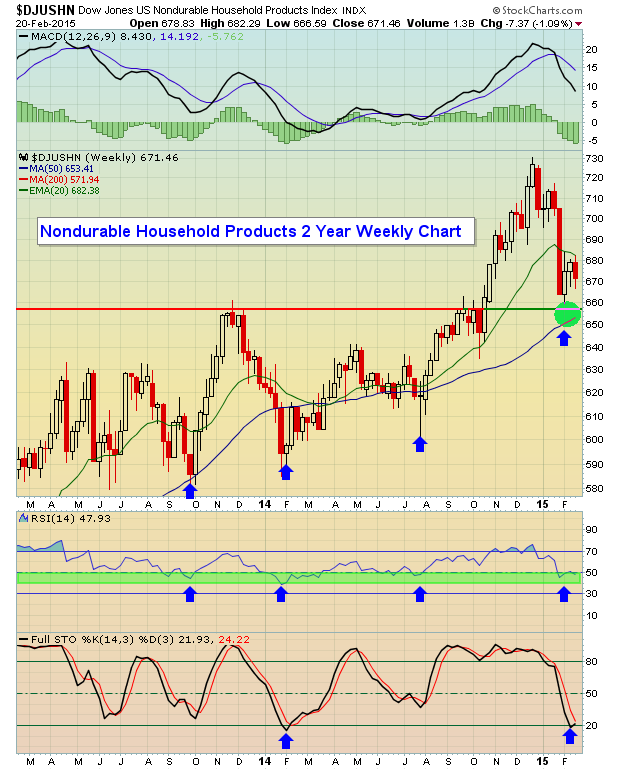
The recent selling has taken place within the confines of an uptrend. Note that each time the DJUSHN has bottomed on its weekly chart over the past couple years, we've seen an RSI in the 40s. On Friday, the weekly RSI was just beneath 48. The green circle highlights an area that I'd watch closely. Price support can be seen in the 650s while the rising 50 week SMA is at 653.
One stock in this industry group has been under tremendous selling pressure lately but is testing major price and gap support. I'm featuring this stock as my Chart of the Day for Monday, February 23rd. If you'd like to check it out, simply CLICK HERE (http://www.investedcentral.com/public/chart-of-the-day.cfm) to register - it's FREE!
Happy trading!
Tom Bowley
Chief Market Strategist
Invested Central


