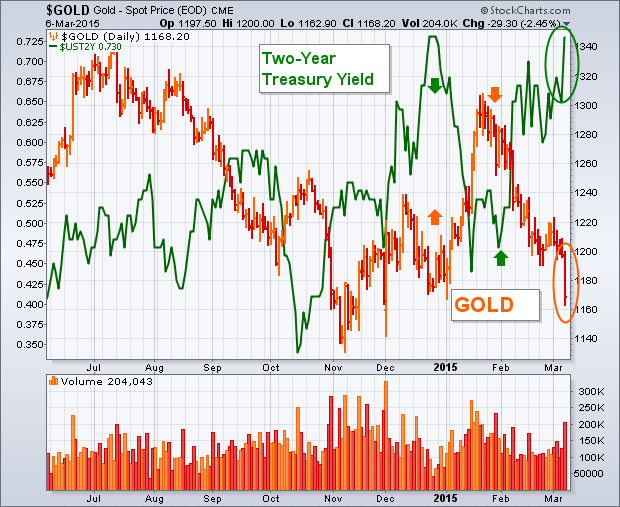
Gold got hit hard Friday on two fronts. One was the sharp jump in U.S. interest rates. The other was the surge in the U.S. Dollar to the highest level in eleven years. The chart below shows the price of gold tumbling $29 (-2.4%) on Friday to the lowest level for the year. And it did so on rising volume. [Gold stocks lost -7.4% and were day's and week's biggest losers]. The green line is the 2-year Treasury yield. The chart shows gold trending inversely to the 2-year yield. That's been especially noticeable since the start of the year. A peak in the yield line at the start of the year helped push gold into a strong January. The upturn in the green line since late January has helped push gold (and gold shares) sharply lower. There are at least two reasons why. Gold is a non-yielding asset. It has more appeal when U.S. rates are low or declining. It loses its appeal when rates start rising -- as they are now. The second reason is that rising rates push the dollar higher which is also bad for gold. Gold is priced in dollars, as are all other commodities. The surging dollar is a main reason why commodity markets in general are doing so badly.