Two months ago, there weren't many better looking industry groups than the Dow Jones US Electrical Components & Equipment Index ($DJUSEC). The breakout above price resistance was clear, but after a continuing advance of another 10% into mid-March, the DJUSEC ran into technical issues. Take a look at the daily chart:
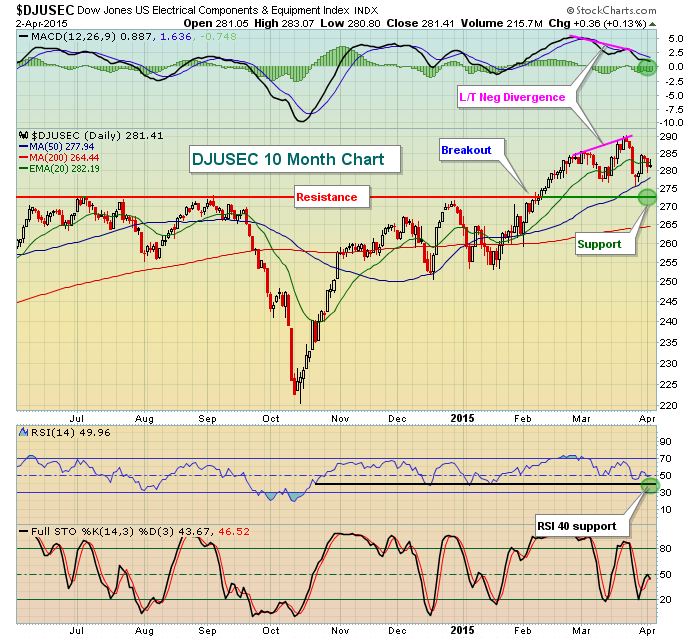
The 272 price resistance was formidable as we had seen several tops at or near this level before finally making the breakout to begin February. Now fast forward to check out the technical problems in mid-March. A long-term negative divergence had formed on the MACD, indicative of slowing momentum. Our other momentum oscillators - RSI and stochastic - both were either overbought or nearly overbought as well. Finally, we had not moved lower to retest the area of the breakout. A pullback over the next couple trading sessions to couple weeks could set up very nice opportunities in this space because there was a continuation pattern in play here. When we see breakouts of a continuation pattern, we can determine a potential measurement and set a target for a stock (or an index in this case). A continuation pattern requires a prior trend, either higher or lower. That trend and the continuation pattern are not evident from this 10 month daily chart, so let's take a longer-term view of a 3 year weekly chart. Check this out:
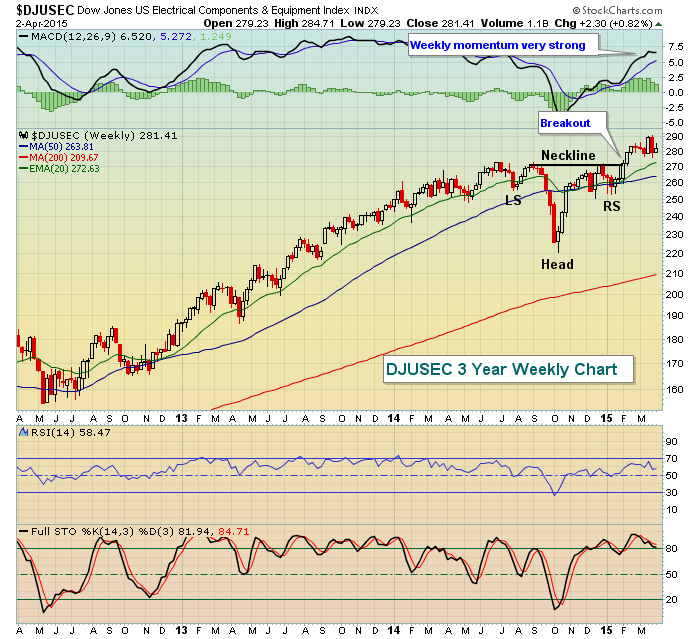
The continuation pattern is the inverse head & shoulders. These follow a solid uptrend and give the index time to pause before another leg higher. While daily momentum (daily MACD from first chart) is questionable at best, the weekly MACD is very strong now so any weakness is likely to be short-lived. I'd look for the rising 20 week EMA, currently at 272, to hold as support. That happens to coincide with price support from the daily chart at 272 as well. The beauty of this pattern is that the measurement can be added to the breakout level of 272. The measurement is determined by the distance between the neckline and the inverse head - in this case roughly 50 points. Therefore, I'd look for a measurement to the 320-325 area in time, although short-term weakness to test the support level mentioned would provide a solid reward to risk entry into stocks within this space.
Happy trading!
Tom


