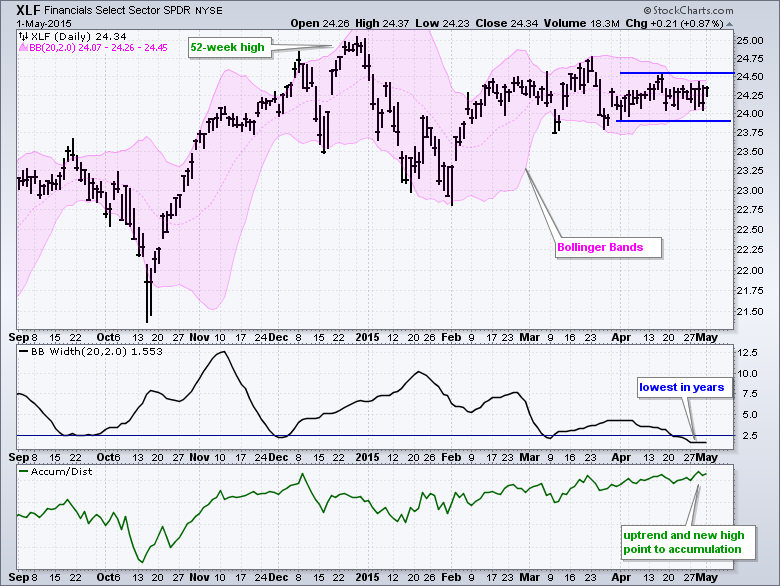
The Finance SPDR (XLF) has become the most boring of the nine sector SPDRs over the last five weeks. Boring today does not mean it will be boring tomorrow though. The chart below shows the Finance SPDR (XLF) surging to new highs in December, bouncing around in January-February and then moving into a narrowing range. The pink shaded area shows the Bollinger Bands in area format and the distance between the bands is the narrowest in years. We can quantify this by adding the BandWidth indicator, which is at its lowest level in years as well. The low Bandwidth tells us that volatility is contracting and chartists should prepare for a volatility expansion.
Bollinger Bands do not give us a directional bias so chartists should turn to the price action and indicators for a signal. The bottom indicator shows the Accumulation Distribution Line (ACDL) moving to a new high last week. This is rather interesting because it points to accumulation within this trading range, and this favors an upside breakout. The blue lines mark the April range and my support-resistance levels. Look for a break above the mid-April high for a bullish signal and a break below the early April low for a bearish signal. StockCharts users can click this chart to see the settings and save it to their favorites list. You can read more about Bollinger Bands and the Accumulation Distribution Line in our ChartSchool articles.

Thanks for reading and have a great weekend!
Arthur Hill CMT


