If you haven't checked out the new DP Scoreboard in the DP Chart Gallery, I highly recommend you click over there soon. In fact, here is an article I wrote about the Scoreboard and how the signals are determined right here. For those of you who are very "visual", the Scoreboard makes analysis of market trends and conditions effortless. Here is the most current Scoreboard for the S&P500.
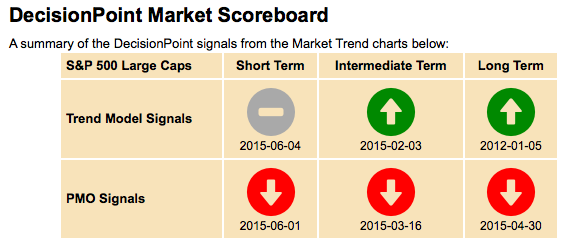
The top row gives you our Trend Model positions which describes price trends in three time frames. The bottom row tells you where the Price Momentum Oscillator (PMO) is located (above or below its signal line) on the daily, weekly and monthly charts respectively. These arrows describe market momentum or condition. How those signals are determined are in this previous DecisionPoint blog article. Note the dates below the arrows. In this case, we see that the recent neutral and bear signals arrived this last week. Market condition turned south starting in March and the Trend is getting worse and time passes. You can also see how the long term price trends affects the intermediate term which affects the short term.
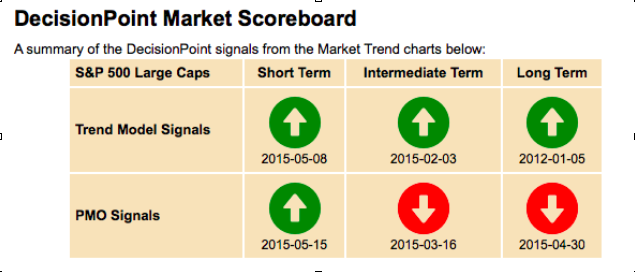
Now back to the deterioration in the S&P500 and the other index Scoreboards. Below is the previous S&P500 Scoreboard. You can see immediately that the arrows have since become more bearish.
The Dow and OEX went through similar changes. Look at the dates when the signals changed. It is recent.
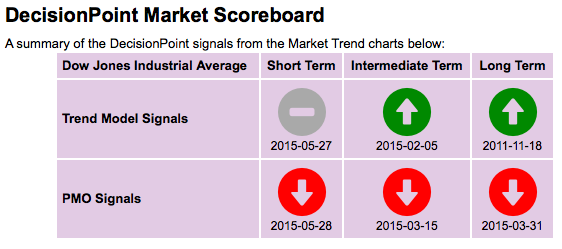
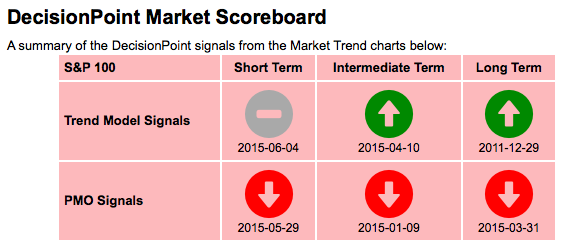
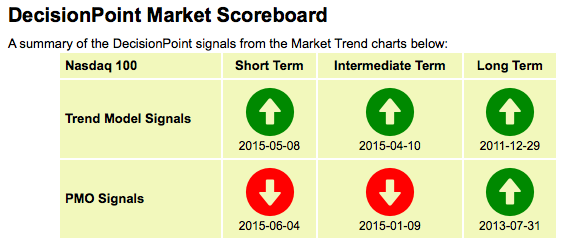
Another use of the Scoreboard is comparing the Scoreboards against each other. Look at the dates on the charts above as well as the arrows. You can see that the first to switch was Dow followed by the OEX and then the S&P500. The final Scoreboard is the NDX below. We see that it currently is holding on to its bullish short-term price trend and only Friday switched to a bearish PMO. This tells us right away that technology stocks are doing far better in comparison.
One important note! Only members can access the Scoreboards for the Dow, OEX and NDX. The S&P500 Scoreboard is in the free area.
Technical Analysis is a windsock, not a crystal ball.
Happy Charting!
- Erin


