The S&P 500 SPDR remains largely range-bound since March, but a pair of potentially bullish patterns emerged and signs of accumulation are appearing. First, note that SPY hit new 52-week highs in May and July, and the overall trend is still up. The ETF is trading within 2% of its July high, but also in the middle of the tightest range in decades. Chartists must, therefore, look inside this range for clues on the next directional move.
For the first pattern, note that an inverse head-and-shoulders pattern could be taking shape since late May. With an overall uptrend, the inverse head-and-shoulders represents a consolidation within an uptrend and a bullish continuation pattern. A break above neckline resistance would confirm the pattern and target further gains. Typically, the height of the pattern (213 - 204 = 9) is added to the breakout for an upside target (213 + 9 = 222).
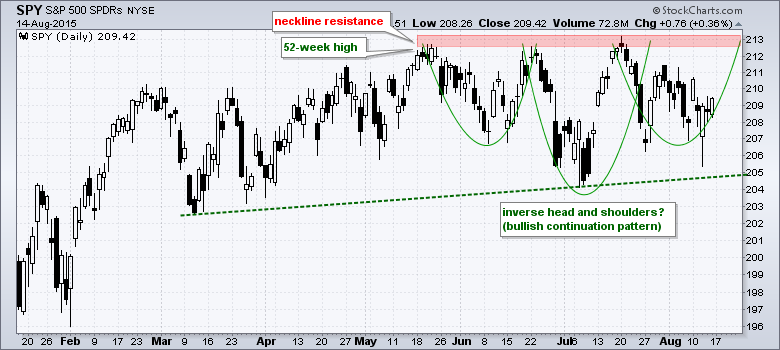
Click this image for a live chart.
The right shoulder looks like a falling wedge, which is typical for corrections after sharp advances. SPY surged from 204.5 to 213 in mid-July and then pulled back with a falling wedge the last few weeks. There was a big intraday reversal on Wednesday, but not much follow through on Thursday and Friday. Look for a close above 211 to break wedge resistance and confirm Wednesday's intraday reversal.
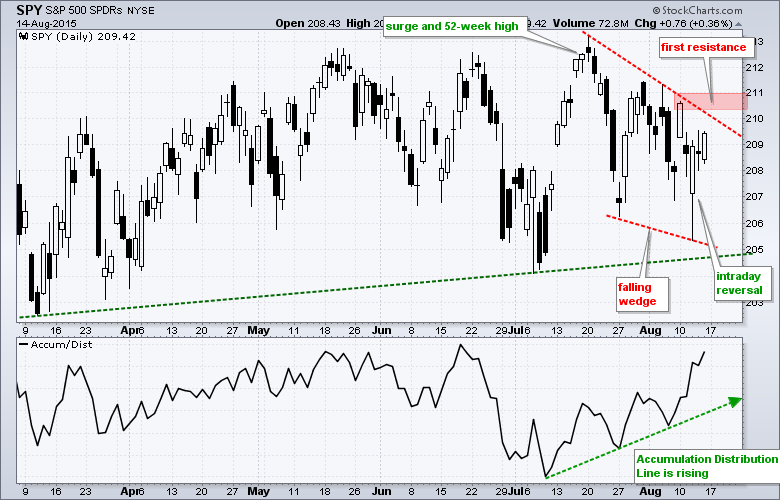
Click this image for a live chart
What are the odds of a breakout? The indicator window shows the Accumulation Distribution Line (ACDL) bottoming in early July and moving higher the last four weeks. Note that this indicator moved higher even as the falling wedge formed. This suggests accumulation within the wedge and increases the chances for an upside breakout.
So why did the Accumulation Distribution Line (ACDL) rise over the last three weeks? This volume-based indicator is based on the level of the close relative to the high-low range. A close in the upper half of this range results in a positive volume multiplier (accumulation) and a close in the lower half results in a negative volume multiplier (distribution). Thus, the closer the close is to the high, the more accumulation. The green shading on the chart below shows the days when the close was in the upper half of the high-low range. Notice that SPY closed near the high of the day for four of the last six days.
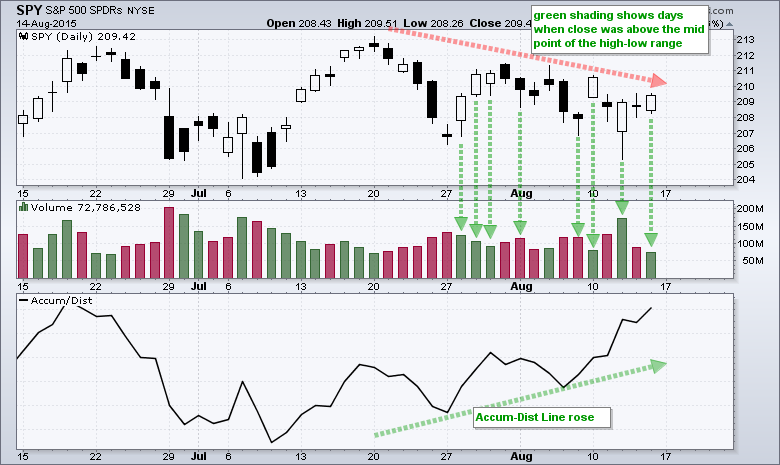
Click this image for a live chart
Thanks for tuning in and have a great weekend!
--Arthur Hill CMT


