
We are deep into earnings season at this point. There have been enough companies reporting so far to make an assessment of what the market thinks of the overall earnings picture as July comes to an end. You can read all kinds of articles and opinions of analysts as to what the market thinks but from my perspective it all comes down to what the charts are telling me.
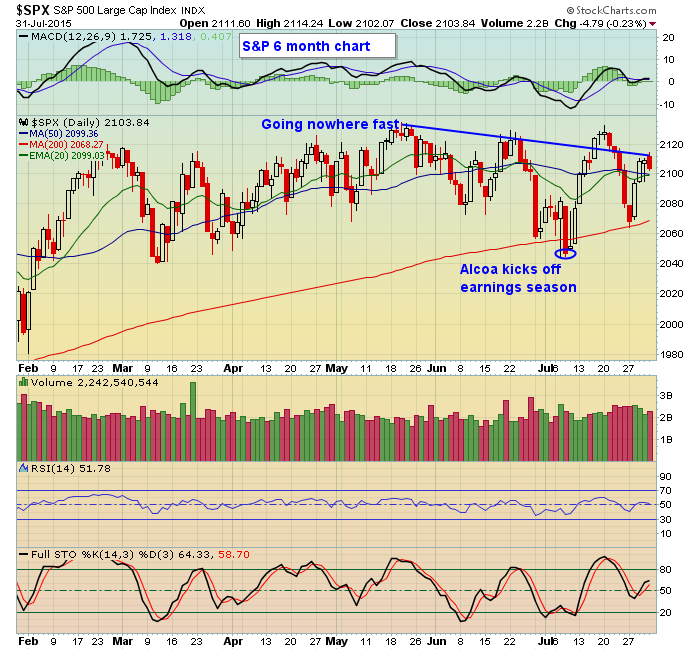
Take a look at the chart on the S&P below. I like to look at the S&P because it represents a good sampling of companies in different sectors. Also, according to Zachs, as of July 29, 263 of the 500 companies in the S&P have reported their numbers, so a nice sampling to gauge from. What the chart is telling me is that from the "official" start of earnings season on July 8 when Alcoa reported its numbers, the S&P has risen almost 2.8%. So on the surface, one could argue that investors have been satisfied with overall earnings. On the other hand, you can see that the S&P remains almost 1.5% below its May 20 all time high of 2134. So as usual, the truth lies somewhere in between; it's not been a great reaction to earnings but it hasn't been horrid either.
Zachs also shows that of the 263 companies in the S&P already reporting for the quarter, over 72% beat EPS estimates. That's potentially good news for traders since there are a lot of potential high reward to risk trading candidates, especially those that also show strong charts. In fact, I plan on conducting a FREE webinar next week that examines companies that beat earnings expectations plus have strong charts, a powerful combination. I will be joined in my webinar by Tom Bowley, Senior Technical Analyst at StockCharts.com, who will be sharing his observations on some of the charts that will be presented during the session. If you would like to register for this FREE event, just click here for more details.
At your service,
John Hopkins
President
Invested Central/EarningsBeats.com


