I don't think so. I'm always a bit leery of August and September because of the historical tendency for the stock market to struggle during the late summer season. Throughout the current 6+ year bull market, the Aug-Sept period has racked up gains four out of six times. But since the turn of the century, we've seen four separate 8%+ selloffs in this late summer bearish period, with the most recent being 2011. So are we setting up for another late summer swoon? Well, one of the key ingredients in any bull market is leadership from aggressive areas of the market. Last year, selling began to grip the market in September with the bottom printing in October. One of the problems last September was that the S&P 500 was making fresh new highs without leadership from three of the four aggressive sectors. On a relative (to the benchmark S&P 500) basis, only technology remained a big part of the leadership on that September high. The others - financials, consumer discretionary and industrials - were all losing ground on a relative basis. Check it out:
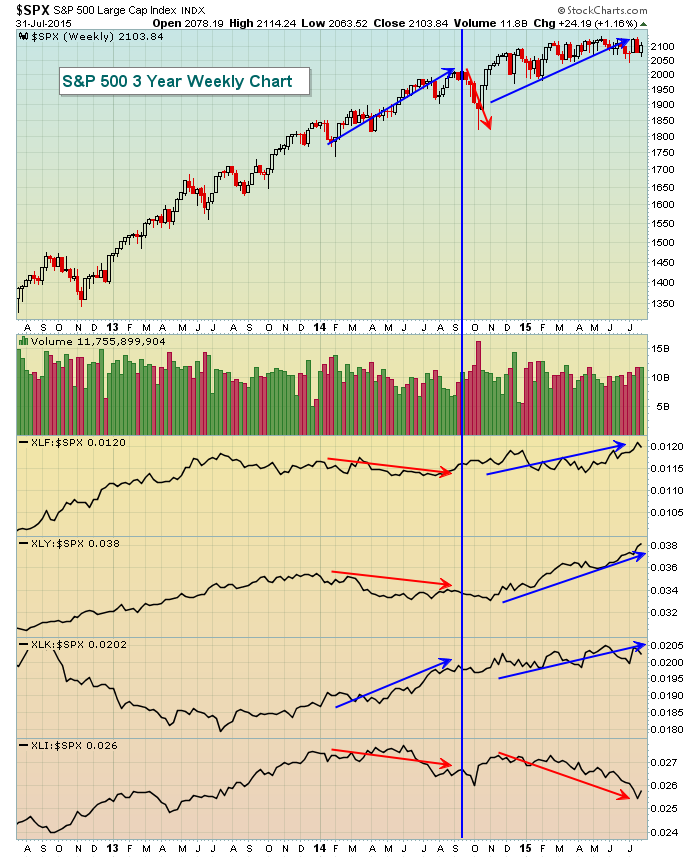
Those three red arrows at the bottom of the chart reflect relative weakness throughout much of 2014 from financials (XLF), consumer discretionary (XLY) and industrials (XLI). Technology (XLK) enjoyed a ton of relative success (blue arrow), but it wasn't enough to keep the S&P 500 from dropping close to 10%. If you again refer to the above chart, you'll see that 2015 has been different as money continues to flow into all of the aggressive sectors on a relative basis, with the lone exception being industrials. There's even a bit of good news there because industrials printed a reversing candle on its weekly chart off of its recent downtrend. Here's the weekly chart on industrials (XLI):
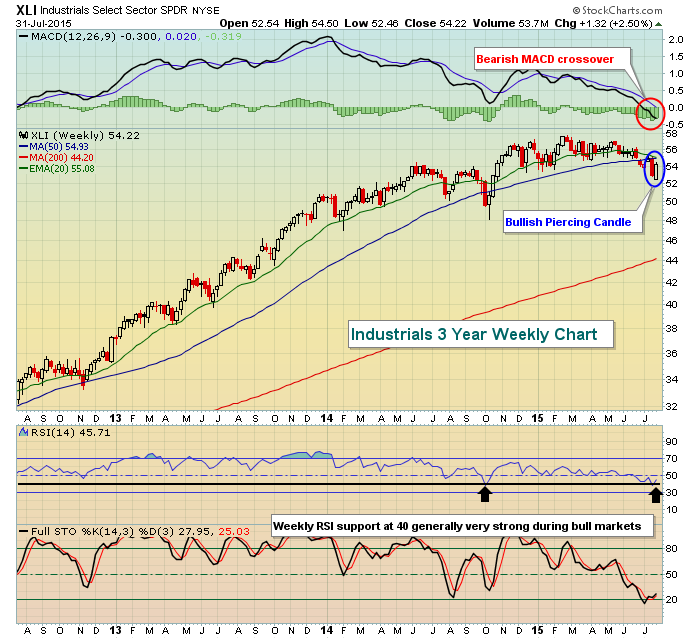
While the reversing piercing candle is a nice short-term bullish signal on the XLI, the MACD crossing below its centerline is not. The bulls will need to recapture both the 20 and 50 week moving averages to encourage additional buying. But if the industrials could begin to see renewed buying, it would make it very difficult for the bears to regain control of the overall action in the market.
So while historical tendencies make me a little nervous, the underlying action continues to suggest the bull market rages on.
Happy trading!
Tom


