Hello Fellow ChartWatchers!
The US markets continue to s-l-o-w-l-y roll over with the Dow Industrials leading the way. Despite the fact that $INDU moved 100 points higher this week, the intermediate to long-term trend is clearly down. Lots of people talked about the "Death Cross" that occurred on the Dow's daily chart on Monday when the 50-day simple moving average moved below the 200-day average, but that should come as no surprise to any reasonably-attentive ChartWatchers. Here's why:
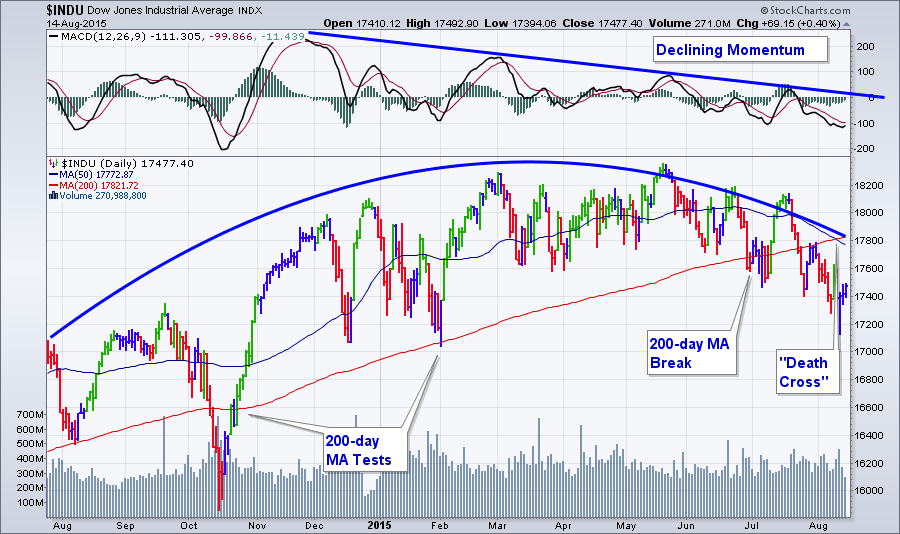
When a market rolls over slowly like this, the first thing to go is the uptrend's momentum and, yes, we see that as the MACD has been moving lower for months. The next thing to happen is increased interaction with the 50-period moving average. Next up are tests of the 200-period moving average and it draws closer and closer. Then comes a definitive break below the 200-period average and then finally the "Death Cross" occurs - which is where we are at with the Dow.
A longer-term weekly chart shows the slow roll-over more clearly. It really is a "text book" rollover:
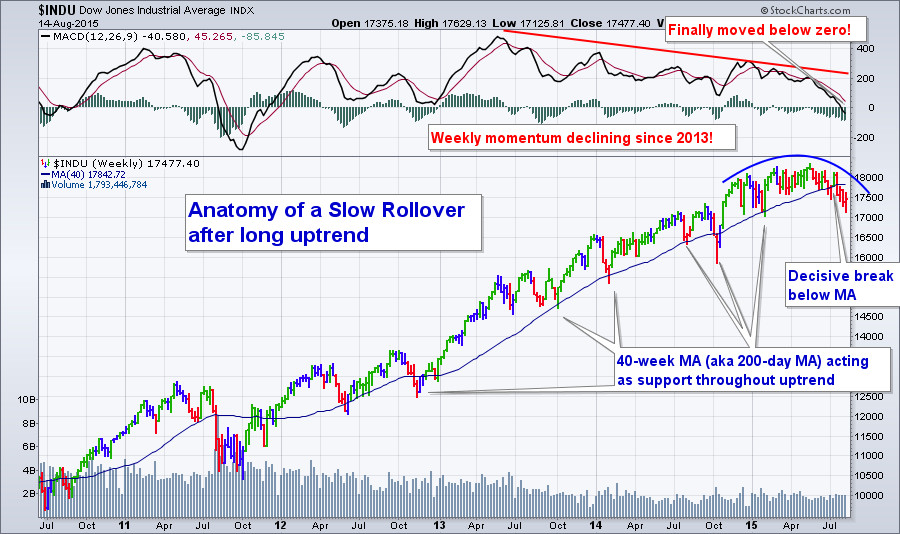
The S&P 500 hasn't rolled-over quite yet but its chart looks very similar to the chart above back in June. The Nasdaq chart offers some hope with the price bars remaining above the 200-day MA for now but something significant needs to change if it is to avoid this same fate.
For more thoughts on the market - including the current breadth and sector situation - be sure to watch the recording of this weekend's ChartWatchers LIVE webinar. Just click here to get started.
As I say towards the end of that recording, there are still stocks out there with positive momentum and great relative strength - you just need to work a little harder to find them and then watch them closely for signs of weakness.
Take care everyone!
- Chip


