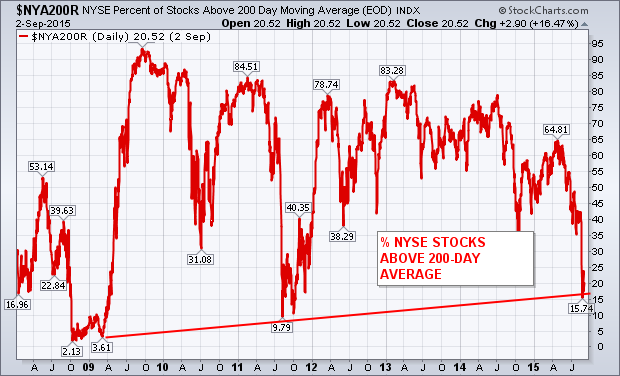
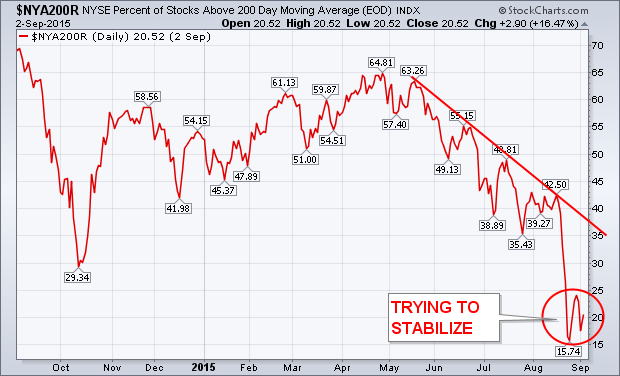
One of the warnings that I wrote about over the summer was the drop in the percent of NYSE stocks trading over their 200-day average. I pointed out over the summer (before the August plunge) that a stock market couldn't maintain an uptrend while two-thirds of its stocks were in downtrends (below their 200-day lines). Chart 1 is an updated version of those earlier charts, and carries good and bad news. First the good news. The red line has fallen below 20% which puts it in a major oversold condition. This is a logical spot for it to attempt a bottom. The bad news is that the red line is still in a downtrend. That has to change. Chart 2 shows the downtrend starting in late April from a +60% reading. Its been all downhill since then. To the bottom right, the line is starting to stabilize (red circle). That's encouraging. But it needs to more to signal a bottom. A good start would be a rise above its late August peak at 24%. A more convincing move would be above its early August high at 42%. It may take awhile for that to happen. But the bottoming process may have started.