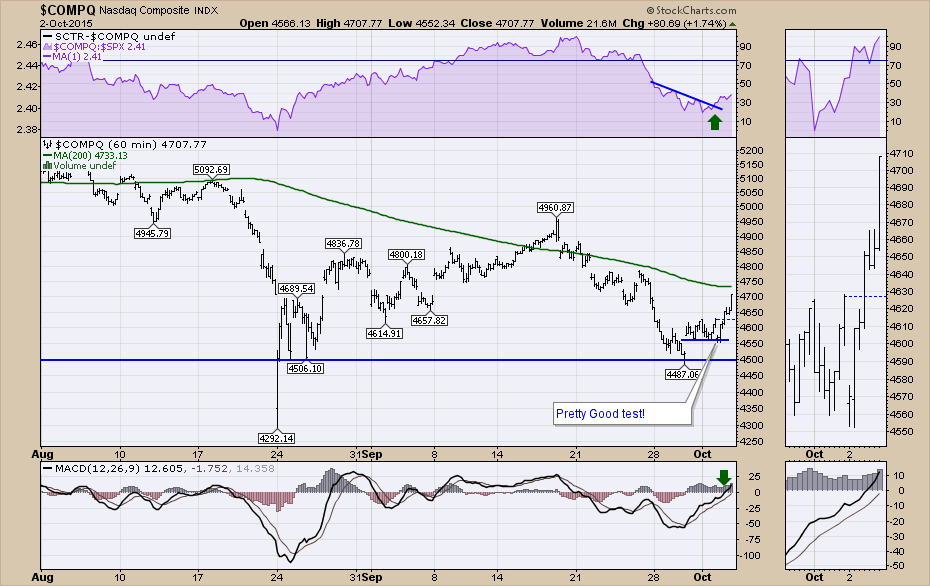
Friday was one of those hugely volatile days where the market plummeted on the bad news of the jobs data and then turned to soar for the upcoming earnings season. It was almost identical to the reversal in October 2011. For the blog watchers of the Commodities Countdown webinar on September 17th, the 34-minute mark discusses what I was watching for to make a bullish reversal. Commodities Countdown September 17, 2015. A big bullish reversal after undercutting the previous lows is what we were hoping for. Earlier in the week, we tested the intraday low of August 25th. The August 24th low was an outlier and Connie Brown's work suggests using the next bar as a good reference point rather than the panic low. With all the bearish news of the weak jobs report, the market dropped like a sack of potatoes and immediately started the rally. The intraday lows took out the 2 previous day lows just to take out any short term stops and then the push to the upside began. The move was a really nice example of the same low that we saw 4 years ago. On October 4, 2011, we broke below the lows and then rallied. This is the current view on the 60-minute chart with a 200 period moving average.
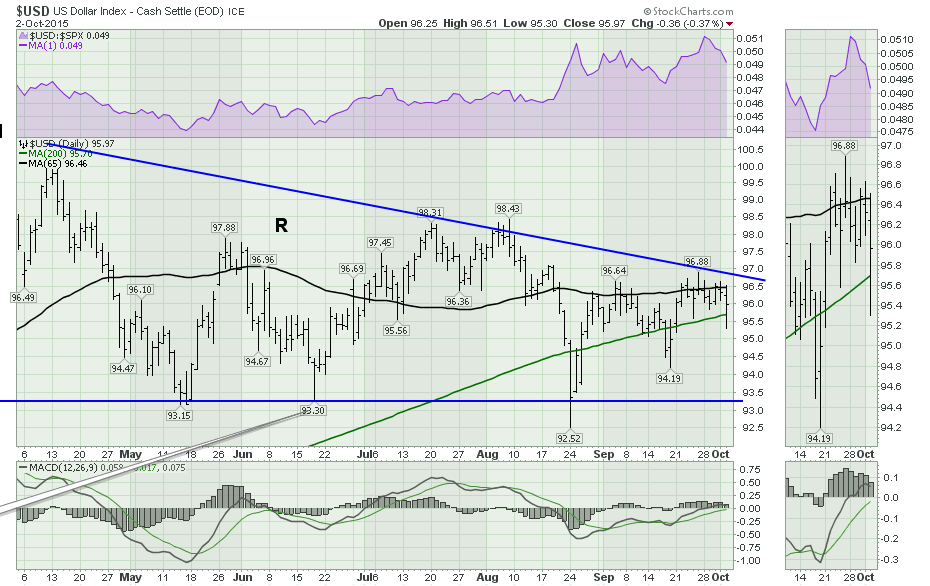
One of the bigger moves on Friday was in the US Dollar ($USD). From the Commodities Countdown webinar on Thursday, October 1, 2015, at the 3-minute mark, the conversation was specific to the currencies and the $USD. Commodities Countdown October 1, 2015. The main focus is the narrowing triangle and which way it is going to break. The discussion centred around the 96-97 levels as critical and that any breakout in the dollar either above the triangle or below the 200 DMA would probably mark the opposite for commodities to meaningfully breakdown or breakout respectively. When the jobs number came in below expectations, the dollar dropped below the 200 DMA and all the commodity charts responded with huge jumps up. Throughout the day the dollar rallied but all of the commodity plays continued to run. Once again we closed back above the 200 DMA.
For the next few weeks, I would expect the rebound to continue especially in strong earnings stocks. My target area would be the 200 DMA on the $SPX around 2060 and we'll be watching for horizontal resistance at the 2080 level. We'll see how much bullish enthusiasm remains once we get to those levels.
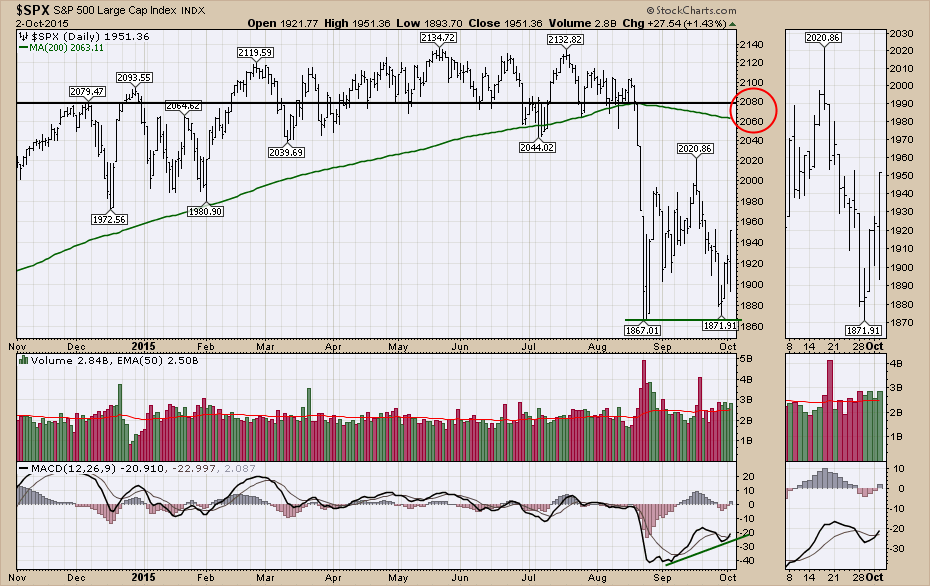
Historically, if we are in a big bear market, the tests of the 200 DMA from the bottom side will be important as a technical decision to complete the change to the bear trend. If the world re-adjusts itself and the bull trend resumes, this will be an important rally to participate in.
Good trading,
Greg Schnell, CMT


