Energy and Utilities have both recently sparked my curiosity. It started with the Energy sector on our DecisionPoint Daily/Market Summary which flipped from Intermediate-Term Trend Model SELL signals to BUY signals. After that, I received a Technical Alert from a scan I have that notifies me when the 50/200-EMAs have a cross over. Recall that when the 50-EMA is above the 200-EMA it is in a "bull market" according to the Long-Term Trend Model which would be on a BUY signal while the 50-EMA is above the 200-EMA. Back to my story, I received the Alert via email that XLU, the Utilities SPDR, had a positive 50/200-EMA crossover BUY signal on the Long-Term Trend Model.
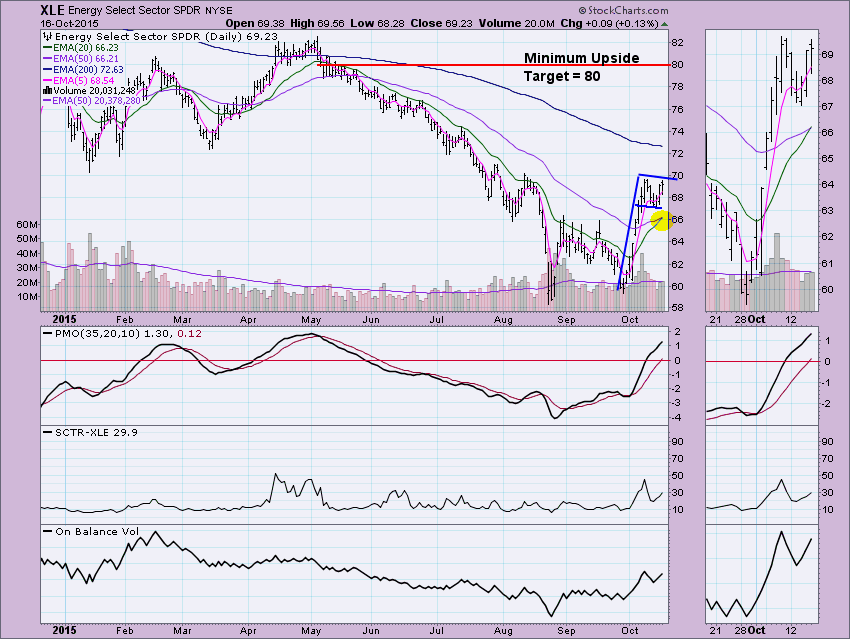
The chart of XLE below has a beautiful set-up and clean indicator crossovers. The flag formation is filling out and should it execute, the minimum upside target is around 80. The positive 20/50-EMA crossover just generated an intermediate-term BUY signal. One might ask why we don't go to a Neutral signal because the 50-EMA is below the 200-EMA. In the case of "buying", our model assumes that we will always want to get in if market conditions are favorable regardless of whether it is a bear market. The one issue that you could have with this chart is that the Price Momentum Oscillator (PMO) is in somewhat overbought territory.
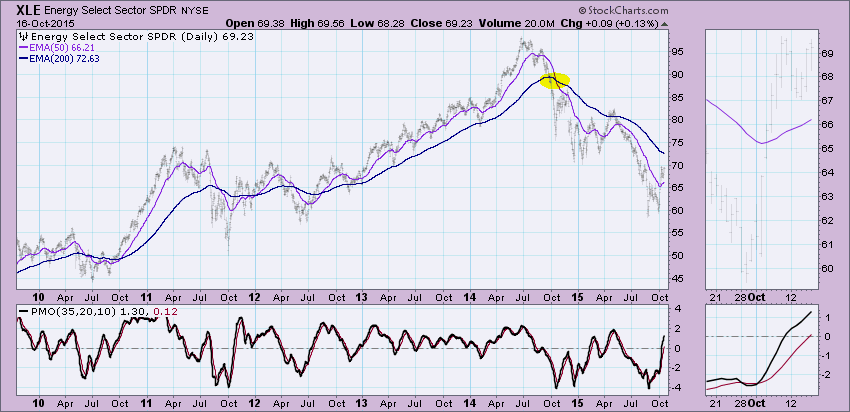
However, when you expand the time frame, you can see that the high range of the PMO reading is at about the "4" range and currently it is reading below 2.
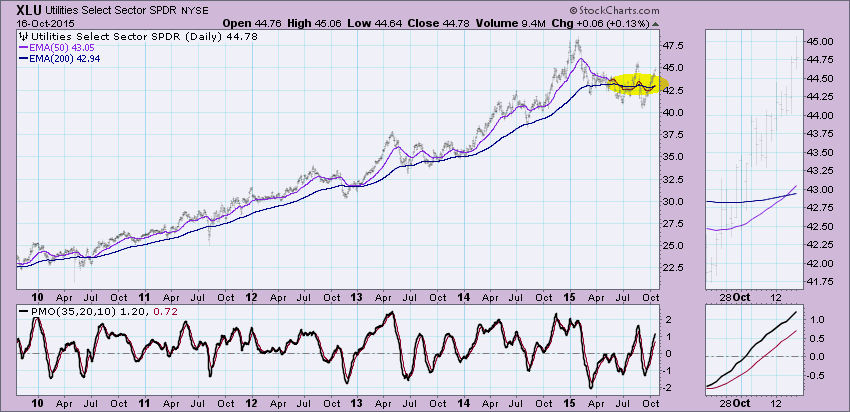
By looking at the same long range chart for XLU, the Utilities SPDR, there are two characteristics that you should take note of. First, the high side of the PMO reading range is about 2 and the current reading is 1.20 so it is somewhat overbought. Second, notice the tight and narrow range for the 50/200-EMAs. So while we did just get a new Long-Term Trend Model BUY signal, it could be somewhat vulnerable to whipsaw which is a rare occurrence for the Long-Term Trend Model.
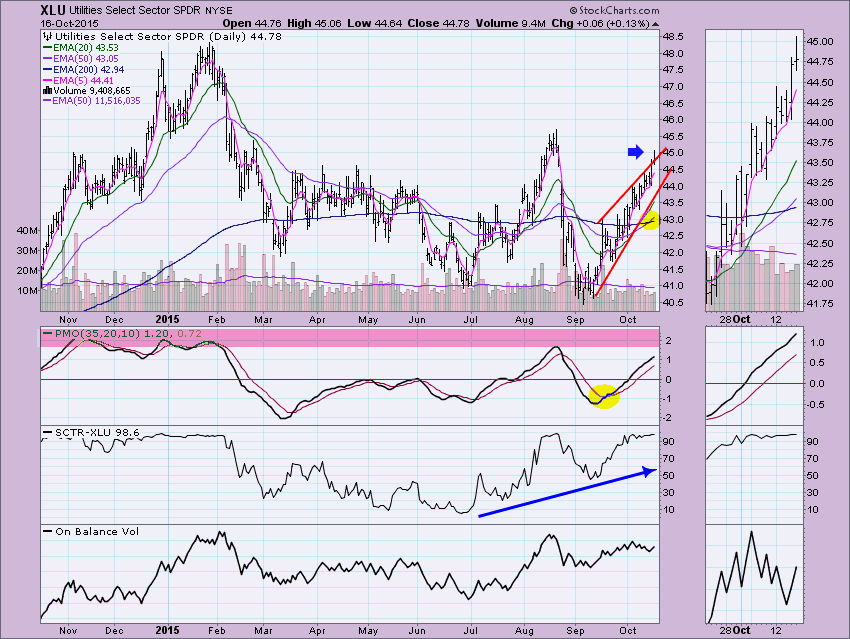
While it is pretty to look at, the undulating EMAs can cause major problems for the Long-Term Trend Model. Seeing on the same annual chart, four separate 50/200-EMA crossovers, leaves me less confident in the signals. The set-up for XLU is clearly different than XLE's. A rising wedge is bearish, but last Friday it poked out above the wedge. If the rally can continue for XLU, it would mean a bullish conclusion to a bearish pattern which is always very positive. The SCTR value is A++ putting it at the top of the relative strength list. I think we should wait and see if it can pop above resistance at the August high. For now it appears that XLU is in a long-term trading range between 40 and 45.
Conclusion: Both these sectors were among the first to flip from SELL signals to BUY signals on the DP Market/Sector Summary but it appears that the Energy sector has the most potential. The Utilities ETF while showing relative strength is at the top of a trading range, meaning profit potential is smaller than XLE's. I invite you to attend the DecisionPoint Report webinars on Wednesday and Friday. They are quick 30 minute shows that give you a run down on the four major indexes as well as Dollar, Gold, Oil and Bonds. You can sign up from the homepage under "What's New".
Technical Analysis is a windsock, not a crystal ball.
Happy Charting!
- Erin
