ChartWatchers

S&P 500 Regains Its 200-Day Average

John Murphy

John Murphy

Chief Technical Analyst, StockCharts.com

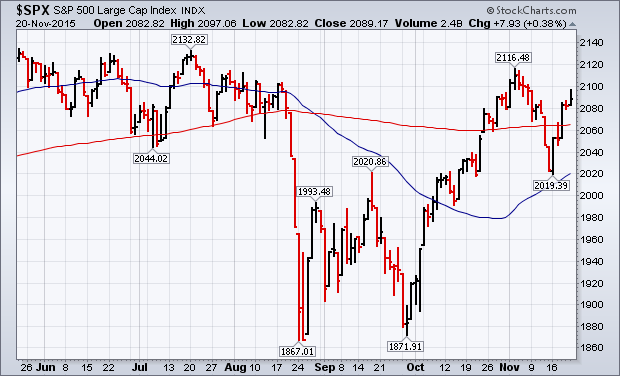
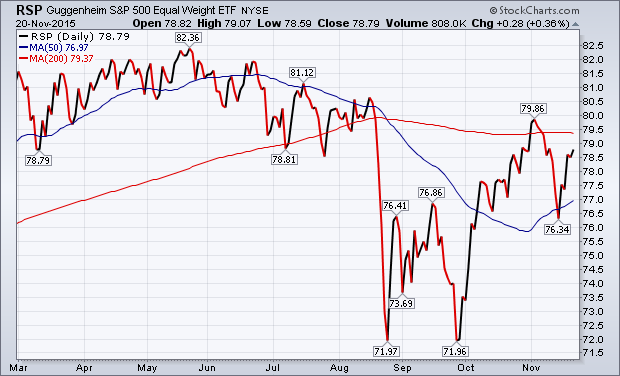
S&P 500 REGAINS ITS 200-DAY AVERAGE -- EQUAL WEIGHTED VERSION LAGS... This time last week, the S&P 500 Index had fallen back below its 200-day average and was testing chart support at its September peak at 2020 (and its 50-day moving average). It survived that test and regained its 200-day line this week. In so doing, its 3.27% gain was the biggest of the year. Large caps, however, which dominate the cap-weighted SPX, are still leading the market higher. The bottom chart shows the Guggenheim S&P Equal Weight ETF (RSP) still trading below its 200-day line. Since all stocks in the RSP are equally weighted, it gives less weight to larger stocks. A move back above its 200-day line would be a positive sign for it and the rest of the market.

Happy Thanksgiving!
- John

John Murphy
About the author: is the Chief Technical Analyst at StockCharts.com, a renowned author in the investment field and a former technical analyst for CNBC, and is considered the father of inter-market technical analysis. With over 40 years of market experience, he is the author of numerous popular works including “Technical Analysis of the Financial Markets” and “Trading with Intermarket Analysis”. Before joining StockCharts, John was the technical analyst for CNBC-TV for seven years on the popular show Tech Talk, and has authored three best-selling books on the subject: Technical Analysis of the Financial Markets, Trading with Intermarket Analysis and The Visual Investor. Learn More