The most recent bounce/rally was impressive, pushing prices toward overhead resistance at the November high or even to all-time highs. The problem is that during that rally, the Price Momentum Oscillator (PMO) didn't react. It did turn negative momentum to "positive" but barely. Take a look at the charts of the four major indexes that we track in the DecisionPoint Chart Gallery, in all of them momentum has been completely flat during this bounce. This suggests internal weakness. Additionally with the OEX and SPX, volume has not been with the rally either.
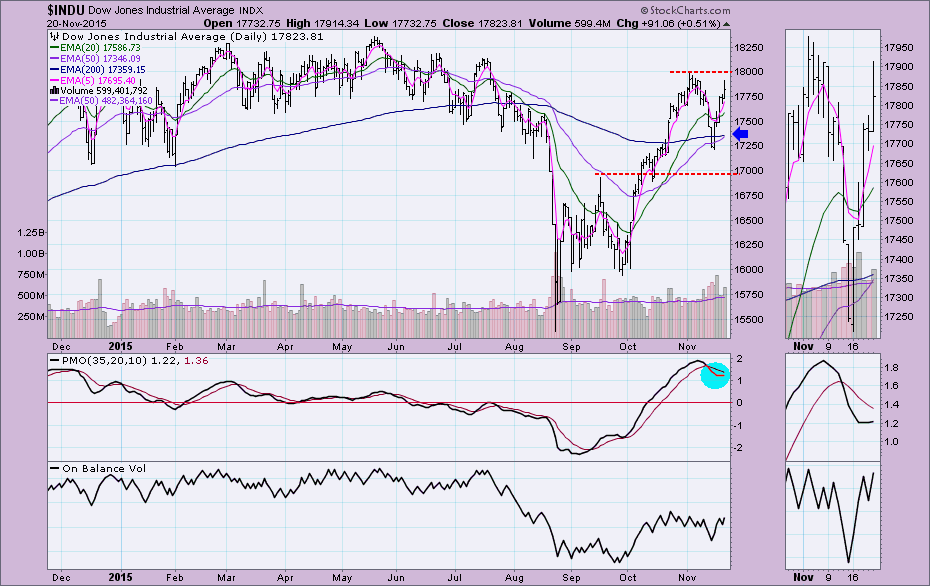
The chart of the Dow Industrials shows the PMO is a flat line. In a rally of this magnitude you would expect to see a PMO that is accelerating upward. Good news for Dow is that it is finally approaching a Long-Term Trend Model BUY signal that would put this index officially back into a "bull market" configuration. If we get a pullback to support at the September high, that signal will disintegrate.
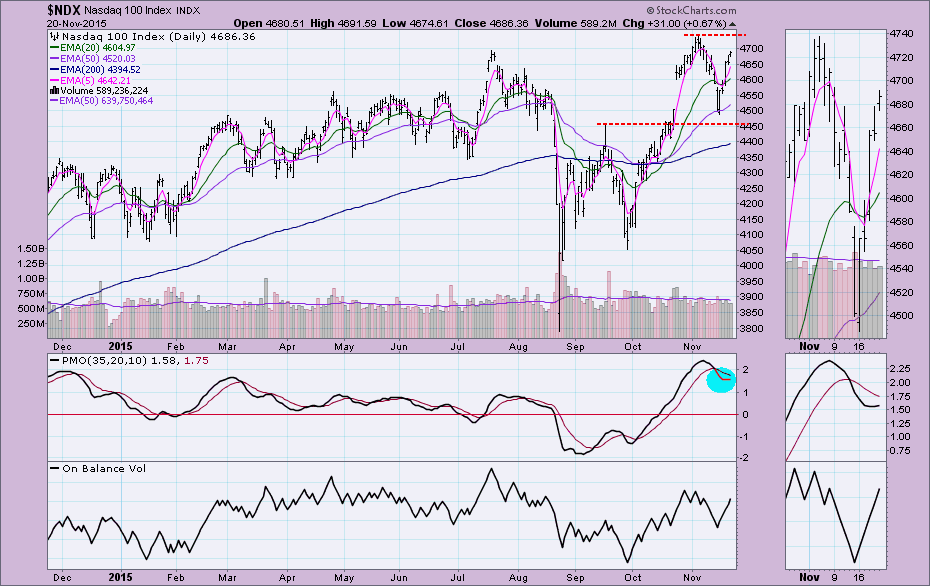
The NDX has been the strongest of the four indexes. It never had a negative 50/200-EMA crossover, so it has remained in a "bull market" throughout the correction and the subsequent rallies out of lows. However, like with the other indexes, momentum is neutral.
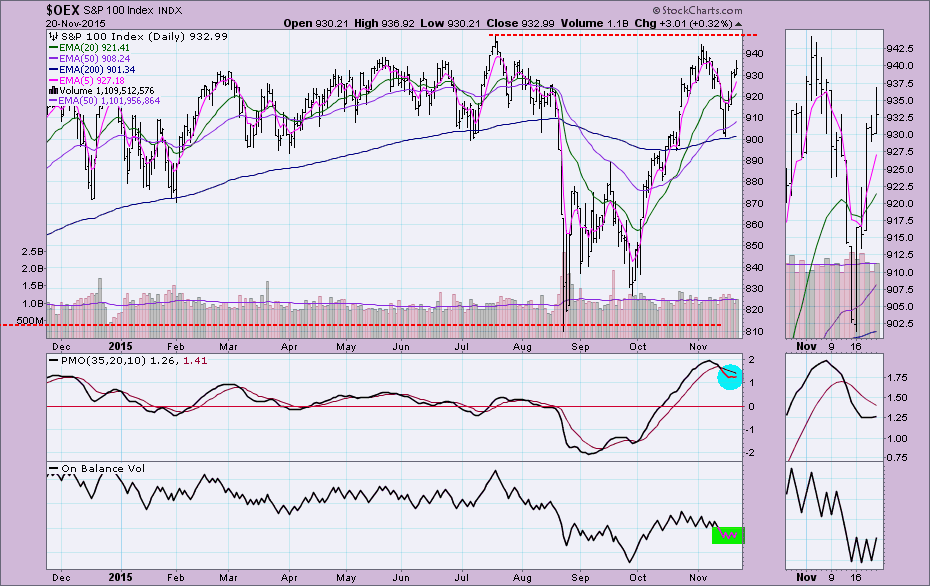
The OEX has the same flat PMO, but in this instance, volume has also been flat. Again, you'd expect both of these indicators to reflect the strength of the recent bounce.
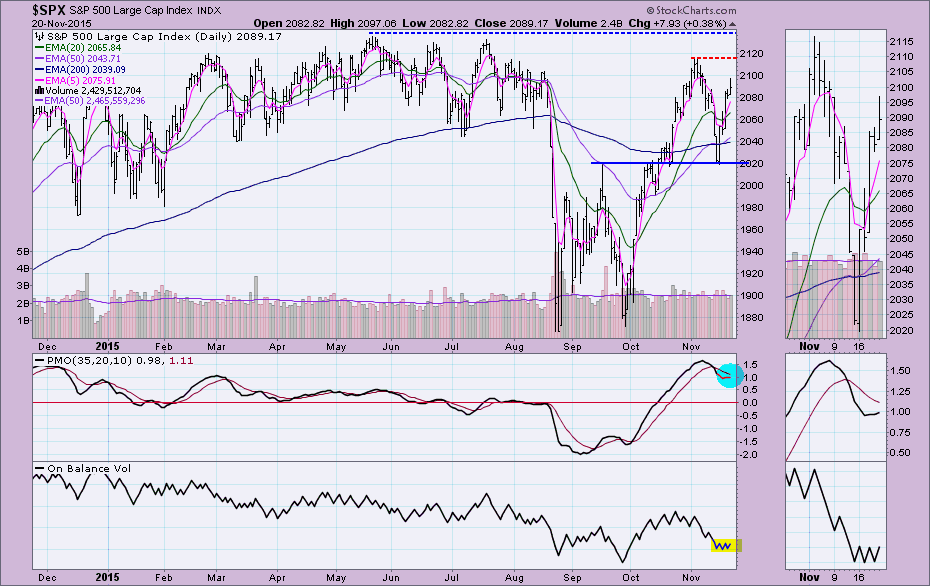
The SPX has the flat OBV and PMO as with the OEX. Overhead resistance is at the November high first. However, that area of resistance is not just at the November high, but also in the midst of the previous congestion that took place as price struggled to make new highs. This should prove too much given the weak momentum.
Conclusion: A flat PMO indicates that momentum is in neutral. After a significant rally the PMO should spring upward, but it was completely unimpressed. The PMO will need to have a positive crossover to fuel a move over strong resistance levels. There is also another issue. Even if the PMOs have positive crossovers, they will be occurring in overbought territory which would be another signal that a pullback, at a minimum, should be expected.


