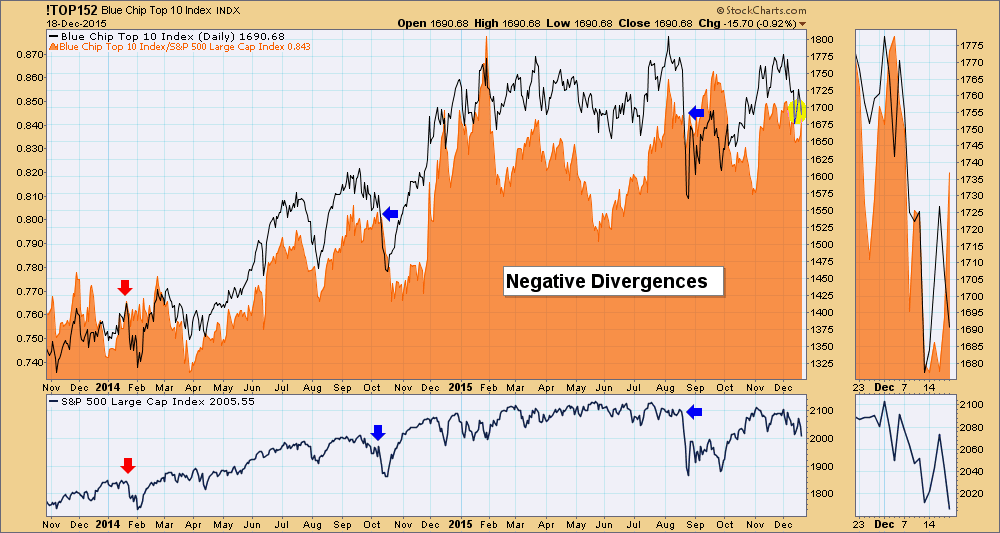
In the late-1990s Carl developed the Blue Chip Top 10 Index (!TOP152), which tracked the top ten ranked stocks (by PMO value) from our Blue Chip list of 152 stocks that DecisionPoint covers in its reports in the DecisionPoint Reports blog. The Top 10 Index is calculated daily based upon the average percentage change of the top ten stocks. This indicator gives us a unique view of failing leadership.
I wrote my last blog article on the deterioration of the Nasdaq 100 which had been outperforming all indexes, but is now showing weakness. This Top 10 daily chart reveals bearish divergences between the Top 10 and its price relative to the S&P 500. We may be entering into a negative divergence between the performance of the Top 10 and the SPX. Previous divergences have been good indicators of price tops which makes sense, if the leaders are underperforming it is hard for the other stocks to carry the weight. You can see that price for the Top 10 dipped into the orange area in the thumbnail in November. This divergence would come at a time when double-tops abound, support has been broken at the November lows, Price Momentum Oscillator (PMO) readings are declining on daily, weekly and monthly charts... Let's keep an eye on this chart.
Come check out the DecisionPoint Report with Erin Heim on Wednesdays and Fridays at 7:00p EST. The archives and registration links are on the Homepage under “What’s New”.
Technical Analysis is a windsock, not a crystal ball.
Happy Charting!
- Erin


