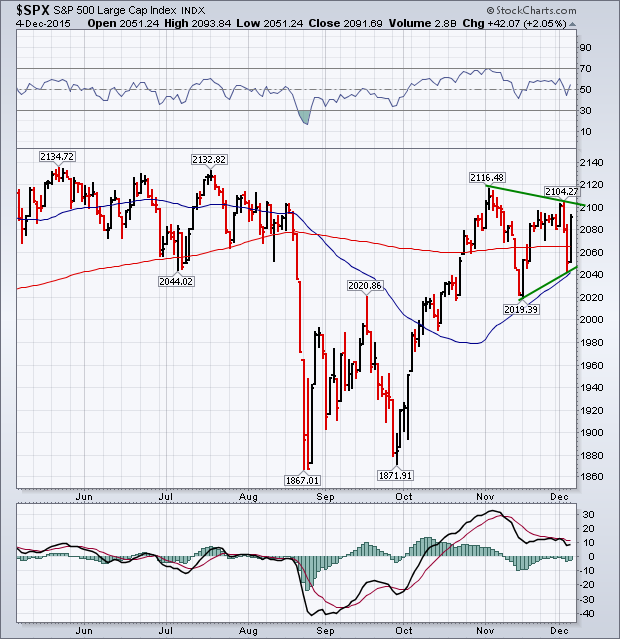
A strong rally on Friday more than erased losses from Thursday and left the market in much better shape. The chart below shows the S&P 500 ending the week back above its 200-day average after bouncing off its 50-day line on Thursday. Chartwatchers will now recognize the pattern of the last month as a "pennant" or "symmetrical triangle" which is defined by two converging trendlines. That's usually a continuation pattern and increases the odds for an upside breakout. That would fit with the seasonal tendency for stocks to end the year on a high note. The 14-day RSI line (above chart) ended above its 50 line. Daily MACD lines (below chart) look poised to turn positive. The main reason being given for Friday's surge was the strong jobs report and increased expectation for higher rates. That, combined with a big jump in bond yields on Thursday, may explain why financials ended the week on such a strong note. The plunge in the dollar on Thursday may also account for the big jump in gold and gold stocks. A drop in crude oil below $40 pushed energy shares lower. Airlines, however, got a boost from falling fuel costs. Technology was the week's strongest sector, led higher by semiconductors. Apple helped lead a Friday rally in that sector.


