
On 12-3-14 the S&P closed at 2074. On 12-3-15 (Friday) the S&P closed at 2091. That's about as flat as you can get over a 12 month period and it helps explain why many traders have had a difficult time scoring big gains over the past year.
We have certainly found it more challenging at EarningsBeats.com, especially when you get out of the blue sell offs like we saw on Thursday only to be followed by an out of the blue surge on Friday. And everything else in between!
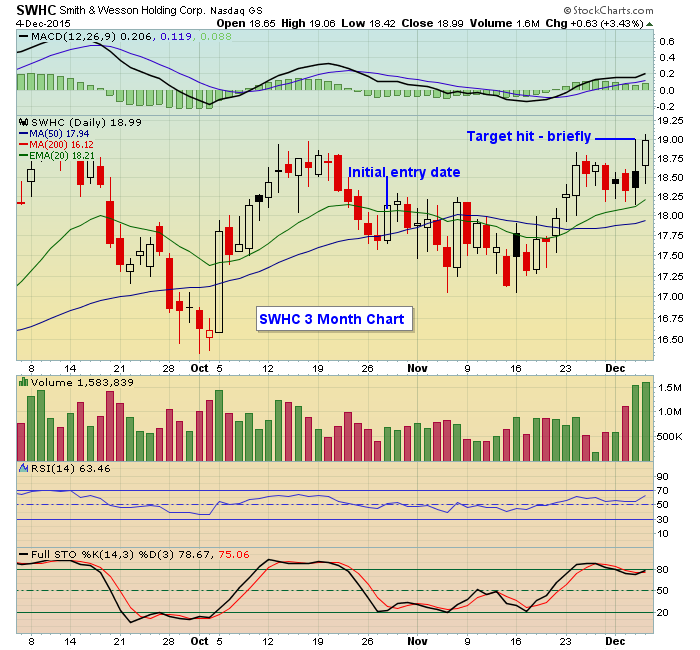
Here's an example shown below. We provided our members with a trading candidate, SWHC, on 10-28-15. This was a stock that both beat earnings expectations and had a strong chart with the stock pulling back to what we felt was a high reward to risk ratio. Our target from initial issue date was $19. If we were right it would turn out to be a quick 6% gain. But it took much longer than we thought it would to get to that $19 level which it finally did this past Thursday. But during the course of the day it quickly fell back close to our initial entry point so if you missed exiting the brief moment it touched $19 all of the gains were gone! Then the next day it moved right back to the $19 level. So a full month plus to get to our target, then over the course of two trading days, a full circle. That's rough.
We have found the market particularly challenging since the August "flash crash"; when the S&P fell from 2096 on August 18 to 1867 on August 24, an 11% drop. Why? Because during that 3 month plus period the S&P has gained exactly 4 points. And let's face it, traders have been on pins and needles during most of that period of time, fearing drops out of the blue just like we saw on Thursday, where months of work can see profits evaporate in just a matter of hours.
There are some times when trading that almost no matter what you try it is going to be tough to make money. So you either have to move completely to the sidelines, reduce the amount of capital you have at work or be prepared to incur some additional losses. This includes honoring stop losses, which is never pleasant, or risk losing even more.
At EarningsBeats.com we provide our members with trading candidates that both beat earnings and have strong charts. The theory is that these stocks will hold up better than others, no matter the market conditions. But it doesn't mean there won't be losers, and especially when the market behaves like it has the past 4 months. It's one of the reasons we almost always provide second entries at a lower price, "just in case" and to reduce the overall cost basis on a trade. And it's why we provide stop losses as well; it can always get worse.
We currently have 120 stocks that are part of our "Candidate Tracker" which includes companies that have beat earnings and have strong charts. We'll be adding another batch over the next few days. If you would like to see a sample just click here.
At your service,
John Hopkins
President
EarningsBeats.com