After the tug-o-war of the last two trading days, I decided it was time to look at sentiment based on the DecisionPoint Rydex Assets Analysis charts. There are two to look at and they are both available in the free DecisionPoint Rydex Funds ChartPack. You'll also find cashflow and asset analysis charts for the Rydex sector and inverse funds within that ChartPack. The beauty of measuring sentiment based on these charts is that it isn't based on a survey or question, it is based in fact, it shows exactly where the money is.
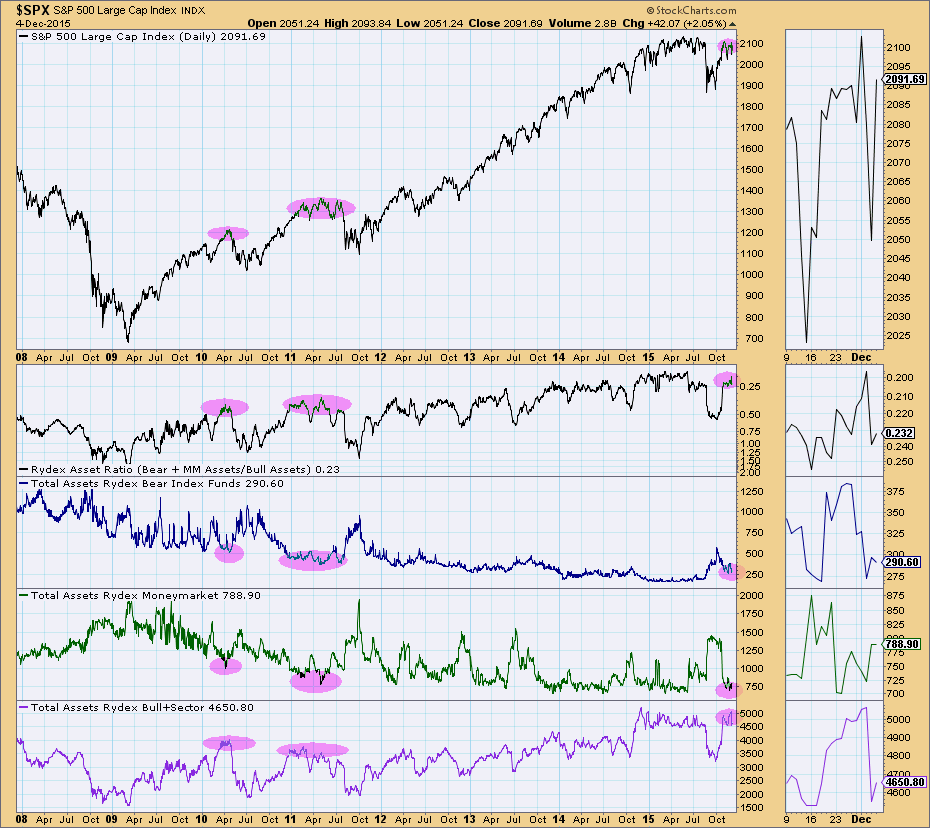
The chart below is the Rydex Assets chart. This chart tells us how many assets are currently in the bull sector funds, bear funds and money market funds. Carl Swenlin developed the Rydex Ratio which takes the total assets in the bear and money market funds and divides it by the assets in the bull funds. I've highlighted readings at major turning point tops. We look for an overabundance of bullish sentiment determined by the ratio. The more assets in the bull funds, the smaller the ratio becomes. Current readings are very overbought. Notice also the bullish sentiment measured by assets in bear and money market funds is at a low--investors are not hedged or in cash.
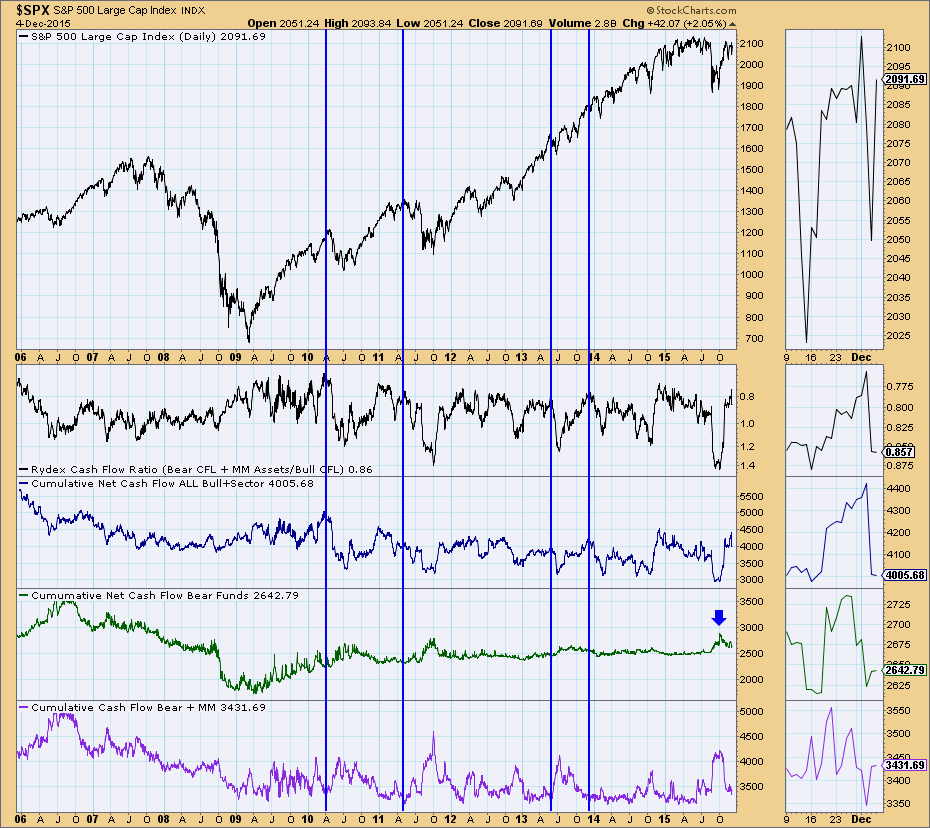
The Rydex Cashflow charts measure the amount of money moved each day into the various bull, bear and money market funds. Basically this chart is showing us how the assets in the chart above arrived at their destination. Carl developed the Rydex Cashflow Ratio to measure sentiment based on the cashflow into and out of the various funds. Currently, the ratio is very small which indicates far more money is moving into bull funds than is leaving bear and money market funds. I annotated the "blip" on the net cashflow for the bear funds. This occurred in response to the correction in August. Cashflow is flying into bull funds and leaving bear and money market funds. This expresses excess bullishness. Sentiment indicators are contrarian, so the expectation is lower prices.
Come check out the DecisionPoint Report with Erin Heim on Wednesdays and Fridays at 7:00p EST. The archives and registration links are on the Homepage under “What’s New”. Erin answers the "question of the day" and reviews all of the major markets quickly and concisely in 30 minutes.
Technical Analysis is a windsock, not a crystal ball.
Happy Charting!
- Erin


