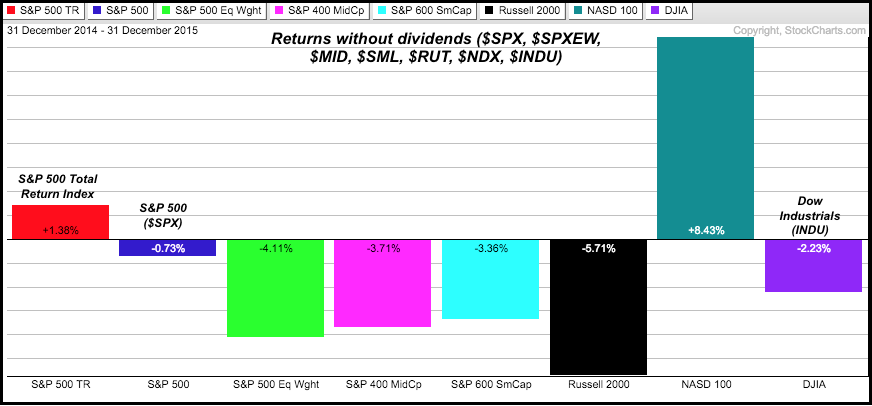
Depending on how you measure it, the stock market was up, down or flat in 2015. It also depends on what you call the stock market. Is it the S&P 500, S&P 500 Equal-Weight Index, the Dow, the Russell 2000, the Nasdaq? Truth be told, it is a market of stocks and not really one big stock market. Chartists using the broad stock market indices will see mostly negative numbers. The Nasdaq brothers, $NDX and $COMPQ, were the only two to gain.
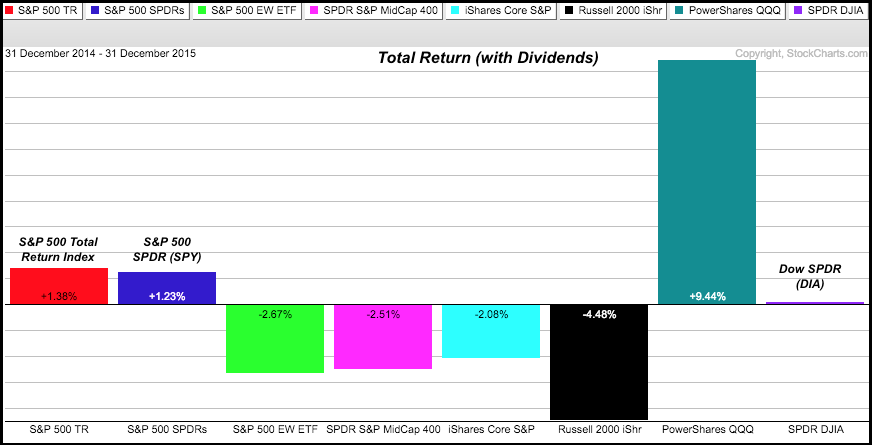
What happens when we add dividends to the equation? There is a total return index symbol available for the S&P 500 ($SPXTR), but chartists need to use ETFs to simulate total return for the other indices. Note that StockCharts provides total return data for ETFs and stocks. This means the dividends are added back into the price so chartists can see the total return one would get on their investment. Taking this into account, the second PerfChart shows S&P 500 Total Return Index with a 1.38% gain last year and the S&P 500 SPDR (SPY) with a 1.23% gain. The Dow Diamonds (DIA) also moved from a small loss to a fractional gain with the dividend. Thus, it would appear that dividends did indeed matter in 2015.
The performance of the major stock indices and major index ETFs tells us it was a mixed market in 2015. This is also confirmed when we break down the performance of the Nasdaq 100, S&P 500, S&P MidCap 400 and S&P Small-Cap 600. Using total return data, note that the Nasdaq 100 had the most winners with 63% of its components advancing in 2015. Netflix, Amazon and Ctrip.com were up over 100%, while another 38 components were up more than 10%. These numbers show broad strength throughout the tech-heavy index. The S&P 500 was literally split down the middle with half up and half down. Performance then deteriorated as we move down in market cap. The S&P Small-Cap 600 had the most losing stocks with around 56% of its components closing lower on the year.

Best wishes for 2016!
Thanks for tuning in and Happy New Year!
--Arthur Hill CMT
*****************************************


