There has been renewed interest in the Percent Buy Index (PBI) ever since I spotlighted it during one of my webinars. The PBI is not related at all to the Bullish Percent Index (BPI). The PBI is Carl's creation, and it tracks the percentage of Price Momentum Model (PMM) BUY signals for the components in a given index. The Bullish Percent Index (BPI) is a breadth indicator based on the number of stocks on Point & Figure chart BUY signals within an index.
The PBI is part of the Thrust/Trend Model of yesteryears on DecisionPoint.com before we joined StockCharts.com. It uses a combination of the Trend Model and a Thrust component made up of our premier indicator, the Price Momentum Oscillator (PMO) and the PBI.
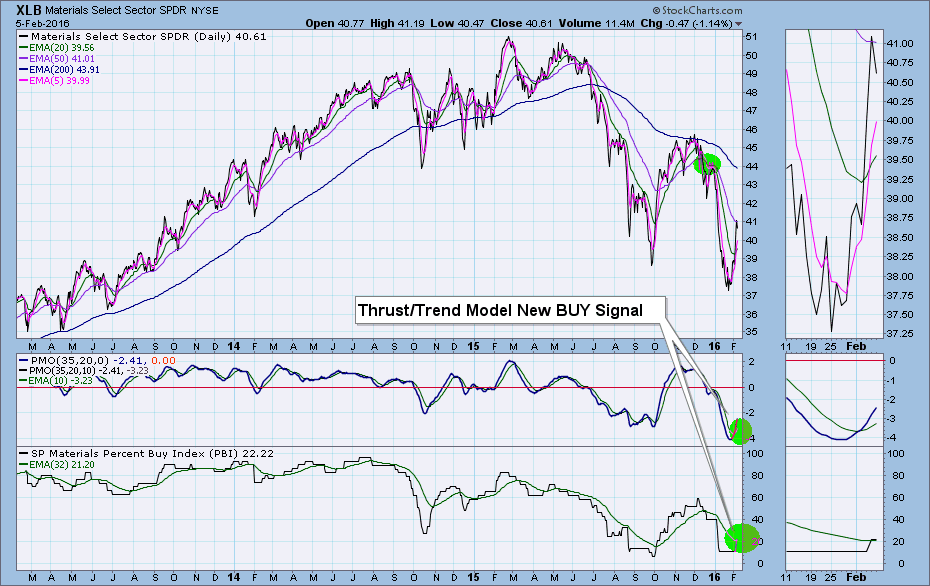
In a nutshell, the Thrust component triggers the BUY signals and the Trend Model confirms them. Once the BUY signal is set, we use the Trend Model "rules" to trigger the next signal, Neutral or SELL depending on the configuration of the 20/50/200-EMAs. (Read the details of the Trend Model here.)
Now that we know the basics, let's look at the chart for XLB. Friday it triggered a new Thrust/Trend Model BUY signal. The PMO and the PBI had positive crossovers. Note that the Trend Model hasn't switched from its SELL signal to a BUY yet. A positive 20/50-EMA crossover generates the Trend Model BUY signal which will confirm the Thrust. Should the PMO or PBI have a negative crossover before the Trend Model confirms the BUY signal, the Thrust/Trend Model signal moves back to what it was previously, in this case a SELL signal. Using the Thrust/Trend Model, we got a jump on a BUY signal.
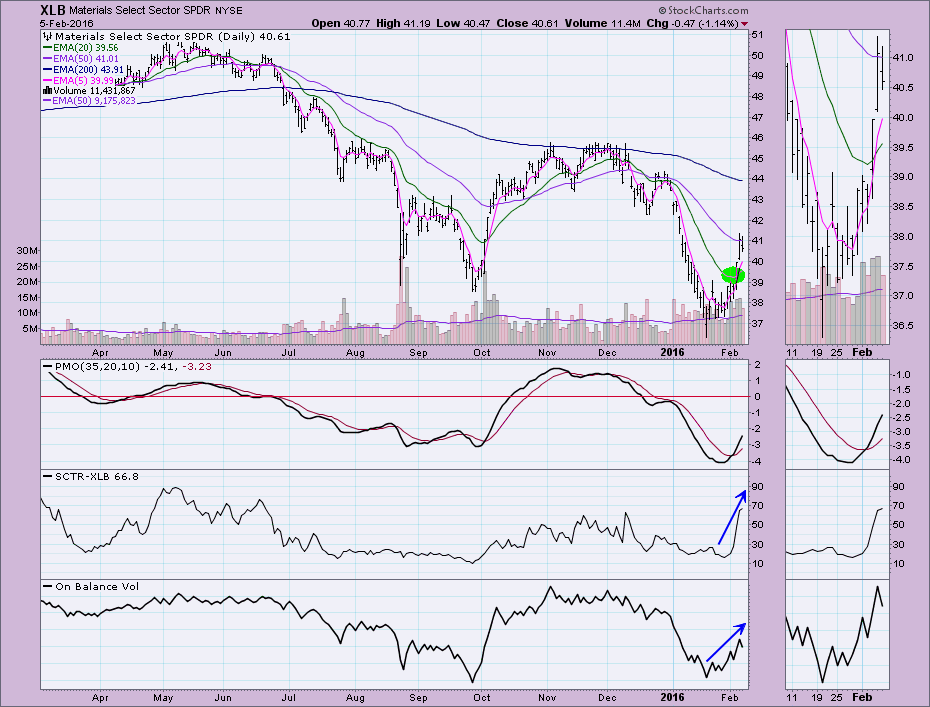
 A look at the daily chart confirms the bullish Thrust/Trend Model BUY signal. Note the Short-Term Trend Model moved to a BUY signal when the 5-EMA crossed above the 20-EMA. The SCTR is rocketing skyward and the PMO recently generated a BUY signal in oversold territory.
The PBI cannot be calculated for an individual stock because it is a market indicator and does require an index or sector with a "basket" of stocks to determine the percentage of stocks within that index or sector on PMM BUY signals. You'll find this chart and other Thrust/Trend Model charts in the free DecisionPoint Market Indicators ChartPack, or you can do a search on "PBI" in the "Create a Chart" box to get the symbols so you can add them to your chart. I don't recommend buying into a bear market, but using a smart combination of indicators (specifically DecisionPoint!), you should be able to limit your risk exposure.
Come check out the DecisionPoint Report with Erin Heim on Wednesdays and Fridays at 7:00p EST. The archives and registration links are on the Homepage under “What’s New”.
Technical Analysis is a windsock, not a crystal ball.
Happy Charting!
- Erin


