Hello Fellow ChartWatchers!
After pausing 5 days to catch its breath, the Dow powered higher this week and is close to breaking overhead resistance from the peak set last November. In addition, the Dow's 50-day Moving Average looks set to move back above its 200-day Moving Average - a bullish signal that is sometime referred to as the "Golden Cross." Here's the longer-term weekly chart:
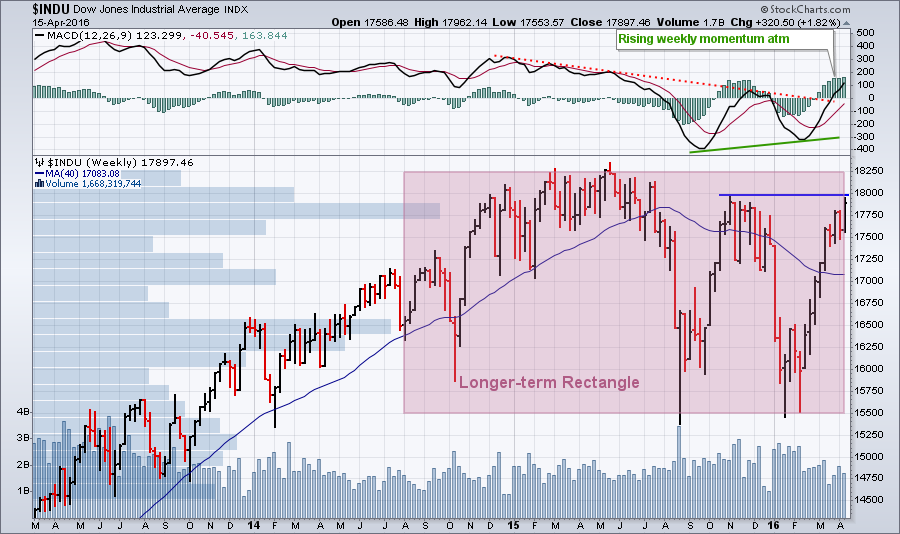 In the larger scheme of things, the Dow has essentially moved sideways - albeit with some huge price swings - since the collapse last August. This sideways movement is throwing off lots of long-term and intermediate-term trend signals (including the "Golden Cross" mentioned above) since there isn't really an intermediate-term trend right now. Yes, the short-term trends have been very pronounced - both up and down - but longer-term, a strong case could be made that the Dow is in a sideways channel (aka a "rectangle" pattern) with boundaries at 15,500 and 18,250.
If that is the case, we are now approaching the top of the channel which means things are very interesting indeed. Will the Dow bounce off the top and move lower like it did - rather viciously - in August and January? That's the big concern right now. Or will it break through and resume the long-term uptrend it was in back in 2014? Rectangle patterns are considered to be "continuation" patterns after all.
In the short-term, the Dow has to get above 18,000 in order for the bulls to have a case. It was unable to do that back in November. Doing so now would be impressive. Stay tuned!
Taking Note of the New ChartNotes Annotation Tool
Today, I am pleased to officially announce the release of our new HTML5-based annotation tool (which we call "ChartNotes"). In case you are unaware, the technology upon which our older version of ChartNotes is based (a platform called "Flash") is slowly being phased out by the major browser providers due to security and performance concerns. In its place, a newer platform called "HTML 5" is taking over. This is a good thing for many reasons including 1.) You don't need to install and maintain a plug-in for HTML5, it's built into the browser, and 2.) It works on more devices include smartphones and tablets.
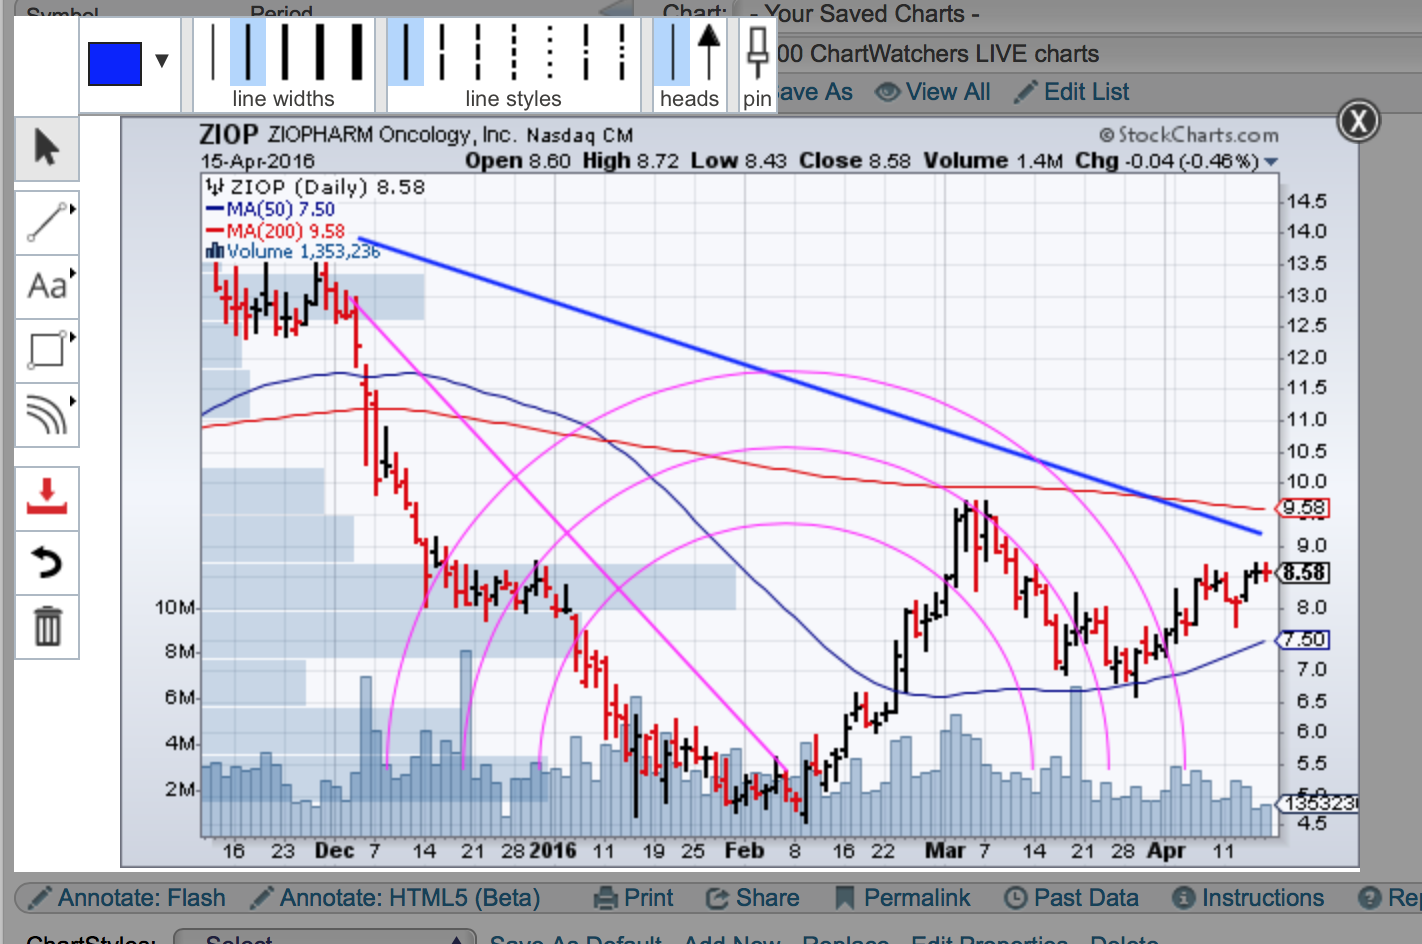
Our new version of ChartNotes was created from scratch and upon first look it appears to be very different from the old version. For instance, instead of a line of tools along the top of the chart, the tools now appear on the left side of the chart. The color-chooser has been completely revamped. Etc., etc. But upon closer inspection, you begin to notice that most things are the same, just located in different - easier to find - locations. Here's a screenshot of the new look for ChartNotes:
 It is important to understand that our current goal for this new version is to simply duplicate the capabilities of the previous Flash version. We are not intentionally adding or removing any functionality, just migrating stuff to HTML5 and the new User-Interface. In addition, we are trying to do things so that charts created in the new version are still editable in the old version.
At this point, the HTML5 version of ChartNotes is still being worked on. It is not 100% complete. There are still bugs that we are finding and fixing. It is in what programmers call "Beta Mode." That means we think that most of it works, but we need more people using it in order to find and fix the more difficult problems. That's where you come in!
To try out the new ChartNotes, simply pull up a chart on our SharpCharts workbench page and find the "Annotate HTML5 (Beta)" link located below the chart. Click on that link instead of the "Annotated (Flash)" link you are used to using.
Here are some key things to remember when using the new version:
- The drawing tools now appear on the left of the chart in several different menus. All of the tools should be easier to find now.
- When an item is selected, you can change its properties (color, etc) using buttons above the chart.
- The rest of the SharpCharts page should be greyed out and unavailable while using ChartNotes.
- When you change something on your chart, the "Save" icon on the left will turn red. Click it to save your changes into your account.
- Click the "Circled X" in the upper right corner of the chart to exit ChartNotes
- Unfortunately, the "XOR" fill mode for shapes is unavailable in HTML5 and has therefore been discontinued.
If you find any problems, please tell us about them using the form on this page:
http://stockcharts.com/support/techsupport.html
Remember that we are actively fixing problems and improving the HTML5 version of ChartNotes. If something doesn't work one day, it might start working the next day as our programmers continually make improvements.
We realize that change is often disconcerting. One of the hallmarks of StockCharts.com is that we try to evolve our website slowly over time so people can get used to new things without having a jarring experience. This new version of ChartNotes is a little jarring at first. Hopefully you'll see enough similarities however to give it a chance and soon it should feel as natural to use as our older version.
Take care everyone,
- Chip


