Hello Fellow ChartWatchers!
The market moved lower this week, retreating from its failed assault on the highs of last August. Optimists can conclude that more consolidation is needed before the market will be ready to put in new highs. Last week's earnings announcements certainly played a roll as well and more time may be needed to fully digest those. Pessimists will trot out the "O" word - "overbought" - and they are correct - the market is overbought from a purely technical perspectives right now. Add in the fact that we are heading into the summer doldrums - a period with lower volumes (and political conventions) - and things could get very interesting very quickly. I'm more cautious now than I was during our last ChartWatchers webinar, that's for sure.
My New Favorite Page on StockCharts.com!
OK, that's a bit of a fib. Just like a parent with several children, I cannot have a "favorite." But I do have a brand new contender for the title. See if you agree. Here's a screenshot:
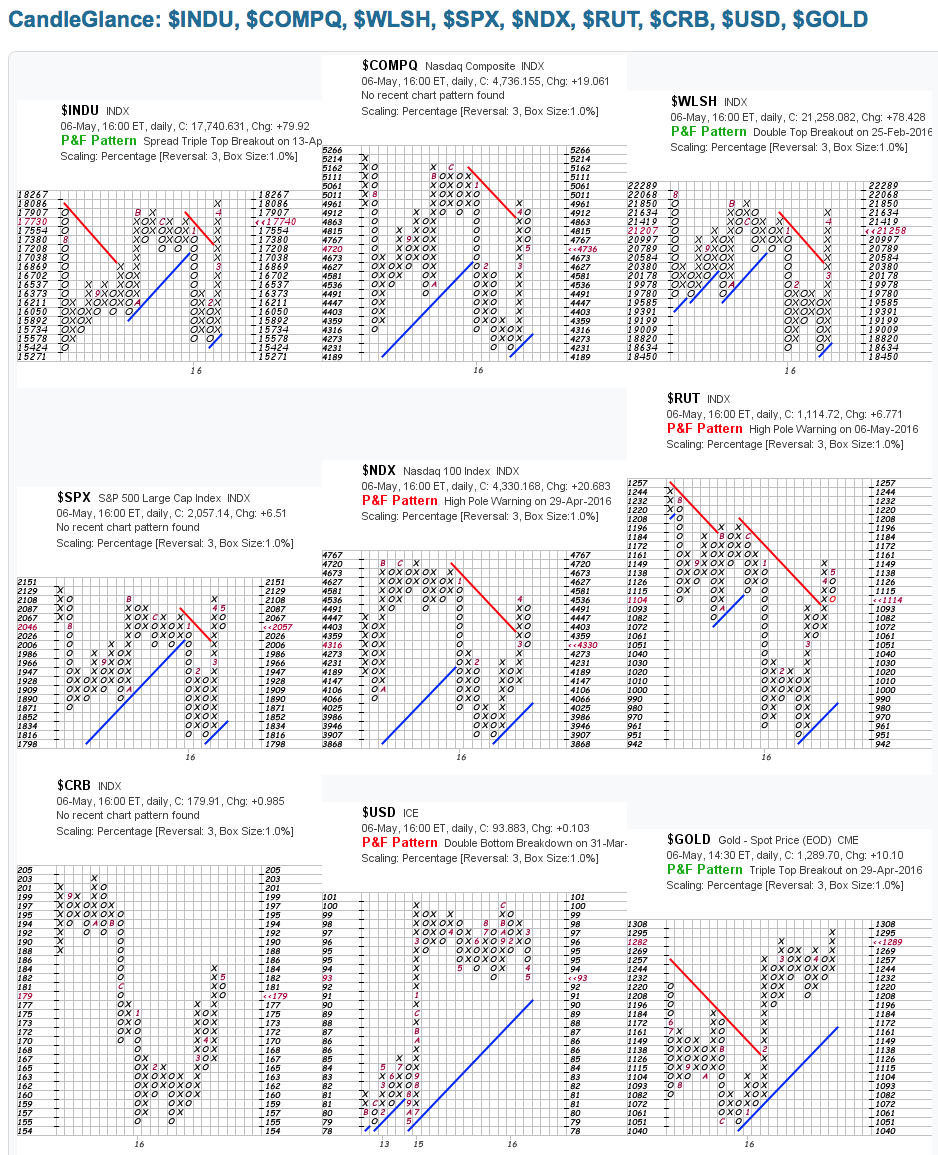 This is our newly updated "Market Overview" index collection displayed in our brand new "P&F Percent" CandleGlance mode. Let me take you through it...
First off, you can see the "big three" market indexes at the top - the Dow Industrials, the Nasdaq Composite, and the Wilshire 5000 (the broadest market index we have). On the next line, we suppliment things with the S&P 500 Large Cap Index, the Nasdaq 100 Index, and the Russell 2000 Small Caps. Those six charts will give anyone a great overall picture of what's happening in the US stock market. Finally, to round things out, we included three non-stock charts - Commodites, the Dollar and Gold. If you study these nine charts on a regular basis, you'll always know where things really are and (hopefully) where they are headed! Just click on the "CandleGlance Groups" link on the right side of our homepage to instantly access this chart collection.
Q: "Hang on Chip - what's with all the X's and O's on your charts above?"
Good point! In the screenshot above, I've shown you the Point & Figure version of that CandleGlance page. To see it, select the "P&F (Percent)" setting from the "Duration" dropdown below the charts.
If you are new to P&F charts, here is a super-short list of things you need to know when looking at them:
- When prices rise significantly, a new column of "Xs" is added to the chart. If prices continue to rise without a significant decline, more Xs are added to the top of the column.
- Similarly, when prices fall, a new column of "Os" is added and, if prices continue to fall, more Os are added to the bottom of the column as needed.
- The chart's volatility (not time) determines how quickly more columns are added to the right edge of the chart.
- The red numbers and letters inside the chart represent the start of a new month.
- Trendlines are always drawn at 45 degrees.
- P&F Patterns are objectively defined (no guesswork) and therefore can be automatically detected.
So, when evalutating a P&F chart, there are a couple of things to look for:
- Is the final column a rising column of Xs (bullish) or a falling column of Os (bearish)?
- Is the most recent trendline rising (bullish) or falling (bearish)?
- Is the most recent P&F pattern green (bullish) or red (bearish)?
- Is the current price marker ("<<") pointing at the very top or very bottom of the current column? If so, that column will probably continue to expand (i.e. the current trend will continue).
There are more, but those are some of the more important basics to focus on.
(For the P&F Geeks out there, I'm also using the new "Percent" scaling option for these CandleGlance charts. It makes each box on the chart represent a 1% move. This works much better for comparing different charts - which is exactly what you do with CandleGlance. We really should have added this a long time ago - doh!)
So... given all that. What does my new favorite page say about the markets right now?
- The Dow is still in breakout mode (a tall rising column of Xs), but could reverse into a falling column of Os if it falls below 17,730.
- The broad Wilshire index is also in a tall rising column of Xs and also is close to its reversal point (21,207).
- Both the Dow and the Wilshire have bullish patterns on their charts (for now).
- ALL of the other stock indexes have already reversed into a falling column of Os with the Nasdaq 100 and Russell 2000 also having bearish P&F patterns.
- While all of the stock indexes have uptrend lines on their charts, those trendlines are still well below the current price action.
- The Dollar has just broken down below a key support level at 94 and may test its uptrend line soon.
- Gold is looking pretty positive with a bullish pattern and a rising column of Xs.
- (I'll leave Commodities as an exercise for the reader. :-)
Hopefully, you will find this page as useful as I do for getting a mid- to long-term view of the market. Again, simply click "CandleGlance Groups" on the right side of the StockCharts homepage, then select "P&F (Percent)" from the "Duration" dropdown below the charts.
Enjoy!
- Chip
